The most common trading errors are a short list: moving your stop, trading too big, revenge trading, chasing an entry, cutting winners early, overtrading, trading without a plan, and trading at your worst hours. Each one leaves a mark in your trade data, so you don't have to rely on memory or guilt to find it. Below is what each error looks like in your numbers, and which tag or report shows it.
How to measure trading errors
Add a mistake tag to a trade when you review it, for example "Moved stop" or "Chased entry". Once about ten trades are tagged, the Mistakes & Habits report compares the average result of trades carrying each tag with your clean trades, the ones you reviewed and logged no mistake on. A bar to the left of zero is what that mistake costs you per trade.
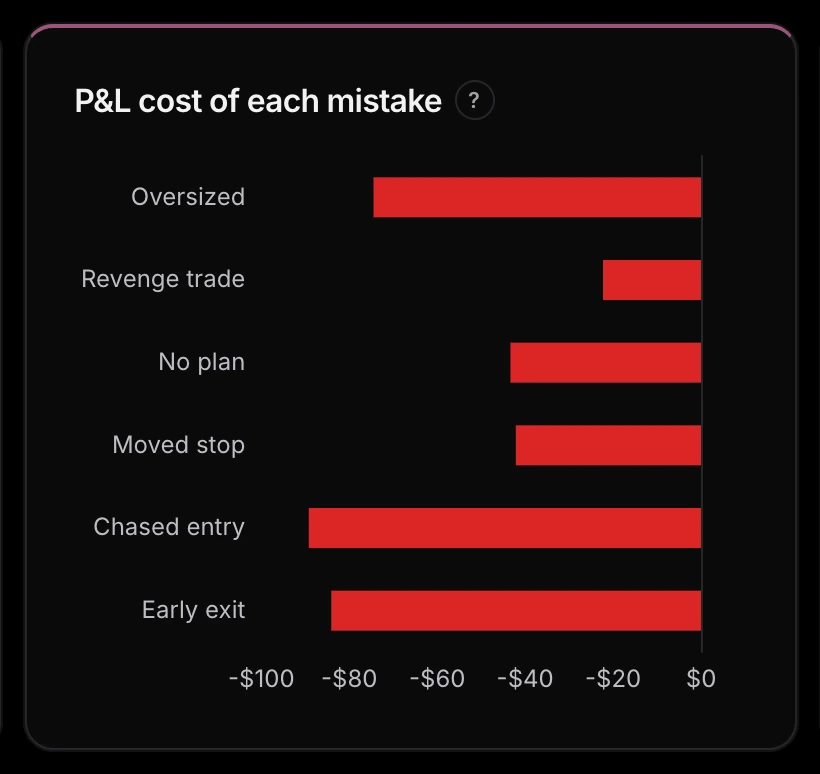
On this sample account, a chased entry cost about $90 a trade against a clean one, an early exit about $85 and an oversized trade about $75. A trade with no plan cost about $45, a moved stop about $40, and a revenge trade about $20. The chart shows cost per trade, so it ranks mistakes by how expensive each one is. A cheap mistake you make daily can still cost more over a month than a costly one you make twice, so read it next to the frequency chart on the same report.
The trading errors that cost the most, and where they show up
| Mistake | What it looks like in your data | Where to see it |
|---|---|---|
| Moving or ignoring a stop | Losses larger than the risk you planned | "Moved stop" tag; R-multiple distribution |
| Oversizing | Your biggest sizes sit with your worst trades | "Oversized" tag; Position size spread |
| Revenge trading | Trades after a loss do worse than your average | After a win vs. after a loss; Re-entry latency |
| Chasing entries | Entries far from your planned level | "Chased entry" tag |
| Cutting winners early | Wins clustered well below your target | "Early exit" tag; R-multiple distribution |
| Overtrading | Average P&L turns negative after a certain trade of the day | Avg P&L by trade # of day |
| No plan | No planned stop, target or risk on the trade | "No plan" tag; plan fields in the trade drawer |
| Trading at the wrong time | Your busiest hours are not your best hours | By session; Day × hour heatmap |
1. Moving or ignoring your stop
A moved stop turns a planned loss into an open-ended one. If you log your planned risk, the R-multiple distribution shows it: a loss of −1R is the plan working, and a bar at −2R or −3R is a stop that was moved or never honoured. Tag those trades "Moved stop" and the cost chart gives you the dollar price of the habit.
2. Trading too big
Size creeps up after wins and after losses, and neither is in the plan. The Position size spread chart shows how many trades you took at each size and notes whether bigger sizes go with worse results. The size creep that follows a run of wins is covered in the winning streak trap. A fixed risk per trade, set in advance, is the fix; see how much to risk per trade.
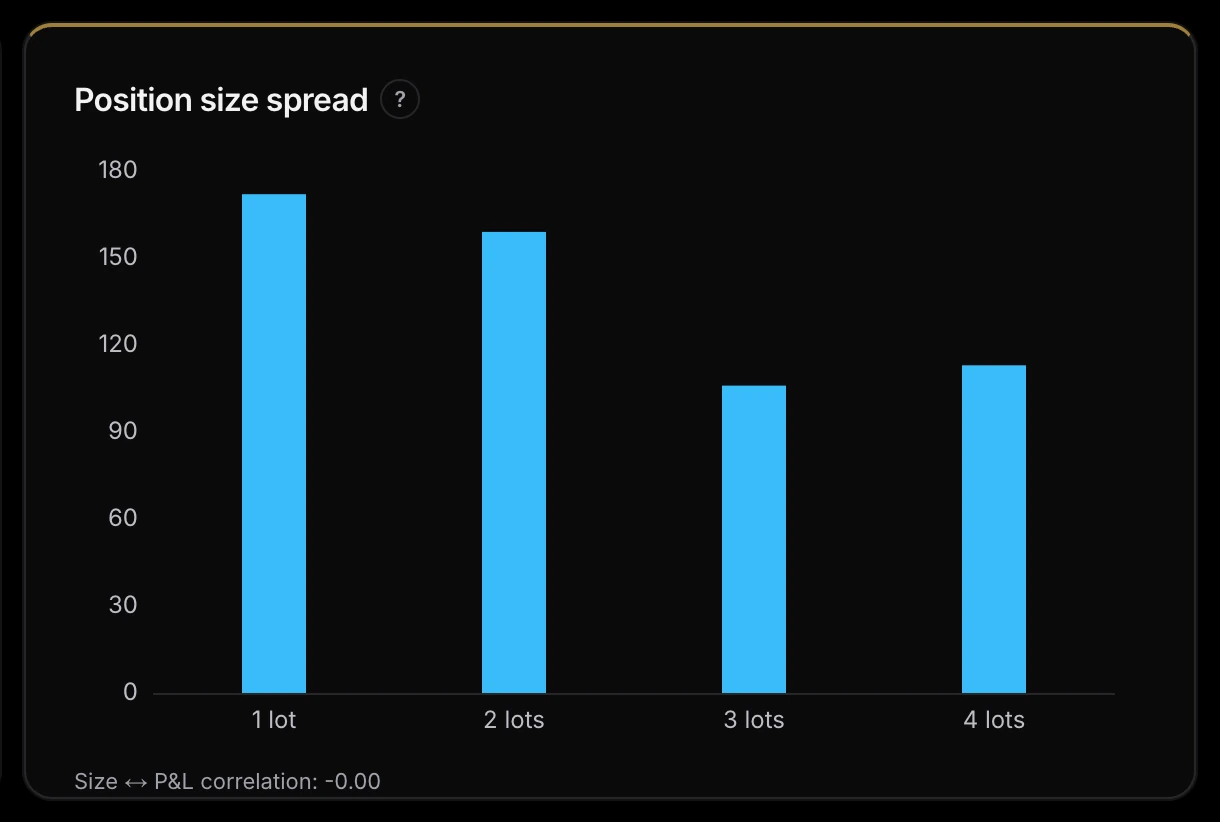
On the sample account the trades are spread across one to four lots and the correlation reads −0.00, so size isn't driving the results. A correlation clearly below zero is the pattern to look for: bigger trades, worse outcomes.
3. Revenge trading
Revenge trading is taking a trade to win back a loss rather than because the setup is there. The After a win vs. after a loss chart splits your average P&L into three groups: all trades, trades right after a win, and trades right after a loss. A shorter bar after a loss is the signal. Re-entry latency adds speed: if you place the next trade much faster after a loss than after a win, you were not waiting for a setup. Both charts need at least ten trades in each group before they show a result.
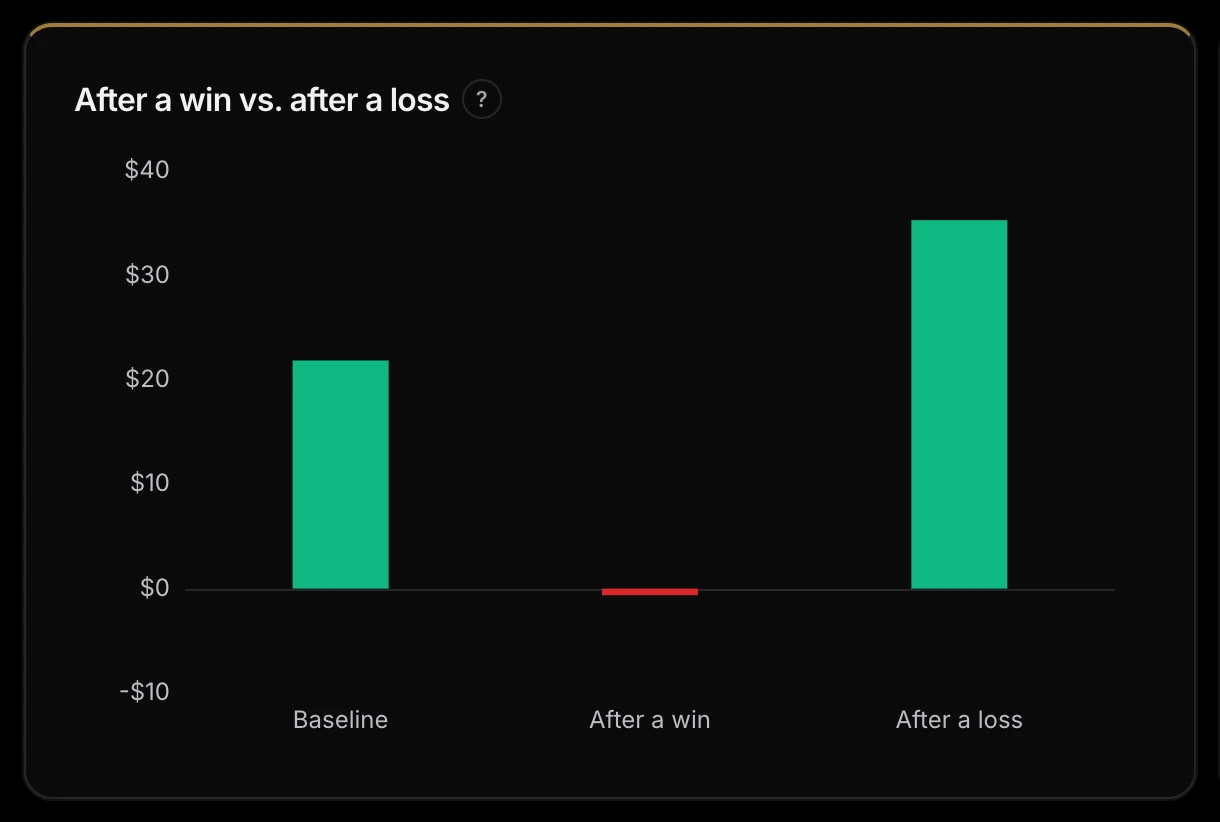
This sample account shows no revenge-trading signal. Trades after a loss averaged about $35 against a $22 baseline, and it was trades after a win that ran flat, at about −$1. A result like that shows no problem with the next trade after a loss, so your time is better spent on the mistake with the biggest bar.
4. Chasing entries
No chart can see that you chased a move, so this is one you tag. After a session, mark any entry you took after price had already left your level. After ten or so tags, the cost chart tells you whether chasing is a habit worth fixing or an occasional slip.
5. Cutting winners early
If your target is 2R and your wins keep closing at 0.5R, the R-multiple distribution shows a pile of bars just right of zero and almost nothing further out. Tag the exits you took out of nerves as "Early exit". The report then compares those trades with your clean ones. For the same reason, a win rate alone can mislead; see expectancy vs profit factor.
6. Overtrading
The Avg P&L by trade # of day chart shows your average result for the first, second, third trade of the day and so on. When the bars turn negative, that is the point where more trades start costing you. The app turns the first negative bar into a suggested daily trade cap, a number to test and not a rule it enforces. Both are on the Timing report, where First trade of day vs. rest compares your opening trade with everything after it.
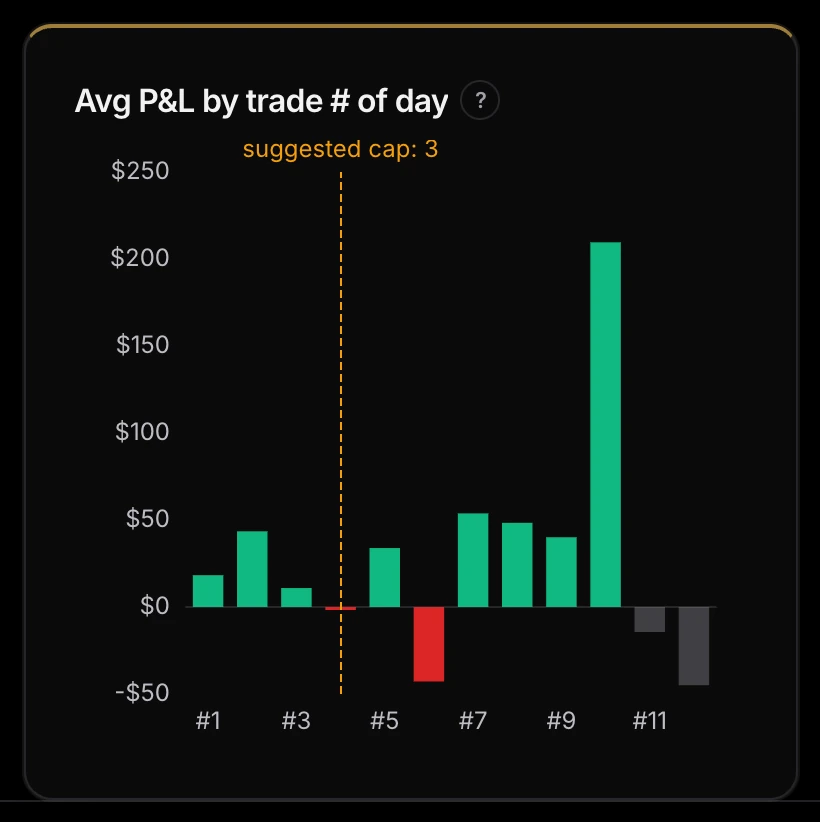
Here trade #4 is the first negative bar, at about −$2, so the suggested cap is 3. Later bars swing both ways, and the grey ones have too few trades to trust. The cap is a number to test for a month, not a conclusion.
7. Trading without a plan
A trade with no planned stop, target or dollar risk can't be checked against a plan afterwards. Record those three fields in the trade drawer before or just after entry, and tag trades that had none as "No plan". The plan vs. actual habit is what separates "the plan didn't work" from "I didn't follow the plan".
8. Trading at the wrong time
The By session chart shows net P&L for each futures session, and the Day × hour heatmap shows the same by weekday and hour. Put the count heatmap next to the average P&L heatmap: if the hours you trade most are the hours you lose most, that is a mistake in your schedule, not in your setups.
How to fix the biggest one
- Pick the mistake with the largest cost and a count you can't ignore, not the one that annoys you most.
- Write one rule you can check on a chart, such as "no more than 4 trades a day" or "stop never moves".
- Keep tagging. The mistakes-over-time chart shows monthly counts, and a falling line means the rule is working.
Be careful with small samples. Ten tagged trades is enough to start asking a question, not to settle it, and the more tags you compare, the more likely one looks bad by chance. Both limits are explained in how many trades before you trust your win rate and your trading tags are lying to you.
Start measuring your own mistakes
Tagging mistakes is part of the journal on the free plan. Import your trades into ExpectancyIQ, tag a few sessions, and open the Mistakes & Habits report. The numbers behind each chart are on the methodology page, and the wider case for logging is in why keep a trading journal. This article is educational, not financial advice.