Trading dashboard

A trading dashboard built from your own trades

Import a broker CSV and see net return, win rate, average win against average loss, drawdown and a 0–100 Trade Score on one screen.

By Reid KashUpdated How we calculate

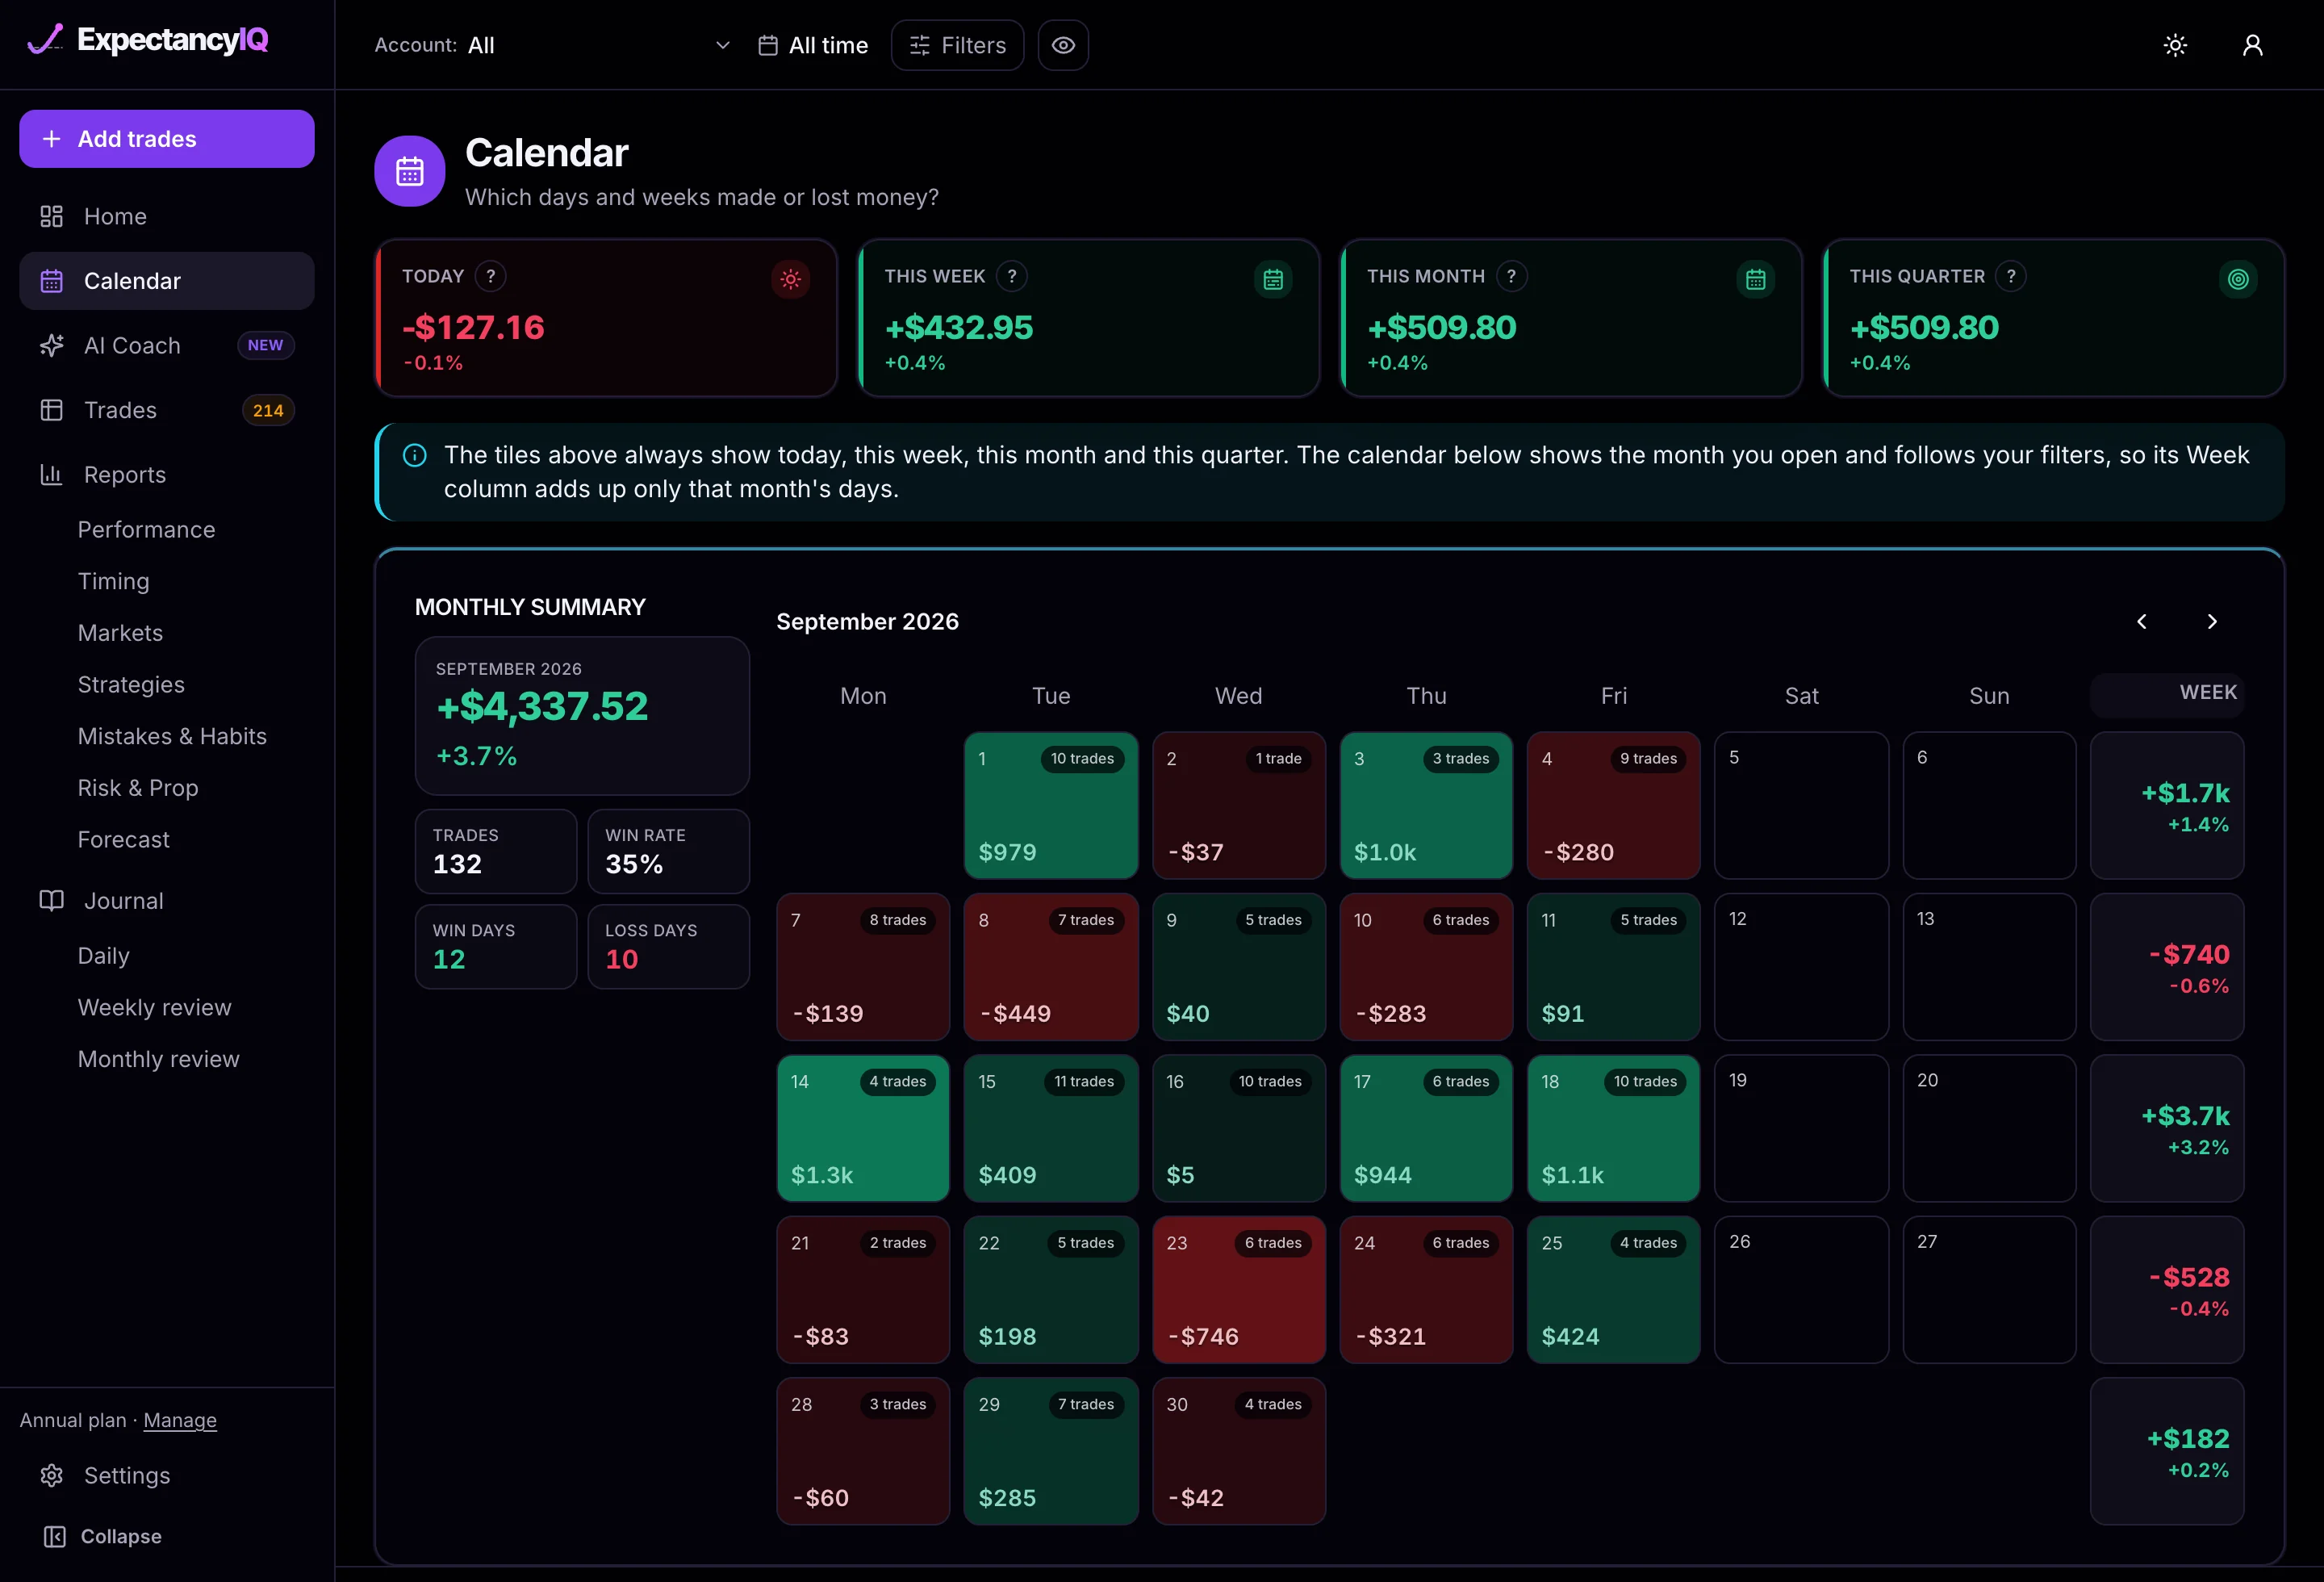
A trading dashboard is one screen that answers two questions: am I making money, and is the way I make it repeatable? ExpectancyIQ builds it from the trades you import, so every number comes from your own fills. The screenshot below is the sample account every new user sees before their first import.

ExpectancyIQ trading dashboard on the sample account: net return +$11,210.86, win rate 40.1% over 556 trades, average win 2.2 times the average loss, Trade Score 77 and an equity curve with 2.2% maximum drawdown
Home on the sample account, in the dark theme. A light theme is one click away.

What a trading dashboard should show

These are the eight cards on Home, top to bottom, and what each one is for.

Net return

Profit or loss in dollars and as a % return that deposits and withdrawals can't inflate, with a small equity curve showing how you got there.

Win rate

Wins against losses on a gauge, with the trade count underneath. Break-even trades are counted as scratches, so they don't drag the rate down.

Average win against average loss

Your average winner next to your average loser, and the ratio between them in R. Read it next to win rate; the worked example below shows why.

Trade economics

Largest win against largest loss, and your longest winning and losing streaks. One outsized loss or a ten-trade losing run shows up here first.

Today, this week, this month

P&L and % return for each period, always anchored to today. They answer 'how am I doing right now' without touching the date filter.

Trade Score

One 0–100 rating from six parts: win rate, profit factor, win vs loss size, drawdown control, consistency and discipline, with its change over 30 days.

Equity and drawdown

Your balance from the starting line, with how far you sit below your peak in dollars and your maximum drawdown in percent.

Recent trades, weeks and days

The last trades with the ones still waiting for a review flagged, plus bars for recent weeks and days so a bad stretch can't hide inside a good month.

Reading the sample dashboard: why a 40% win rate pays

The sample account wins only 40.1% of its 556 trades. It still makes money because the average win is $159.29 and the average loss is $73.01, so each winner is worth 2.2 losers.

Put the two together and you get expectancy, the average result per trade: 40.1% × $159.29 − 59.9% × $73.01 = $20.16 a trade. Over 556 trades that is $11,209.34, within $2 of the net return tile; the gap is rounding in the two averages. The expectancy calculator does the same sum for your own numbers.

The equity card shows the cost. The deepest drop from a peak was 2.2% of the account. A high win rate can still lose money when the average loss is bigger than the average win, and expectancy is the figure that catches it. Every formula is on the methodology page.

Trading analytics behind the dashboard

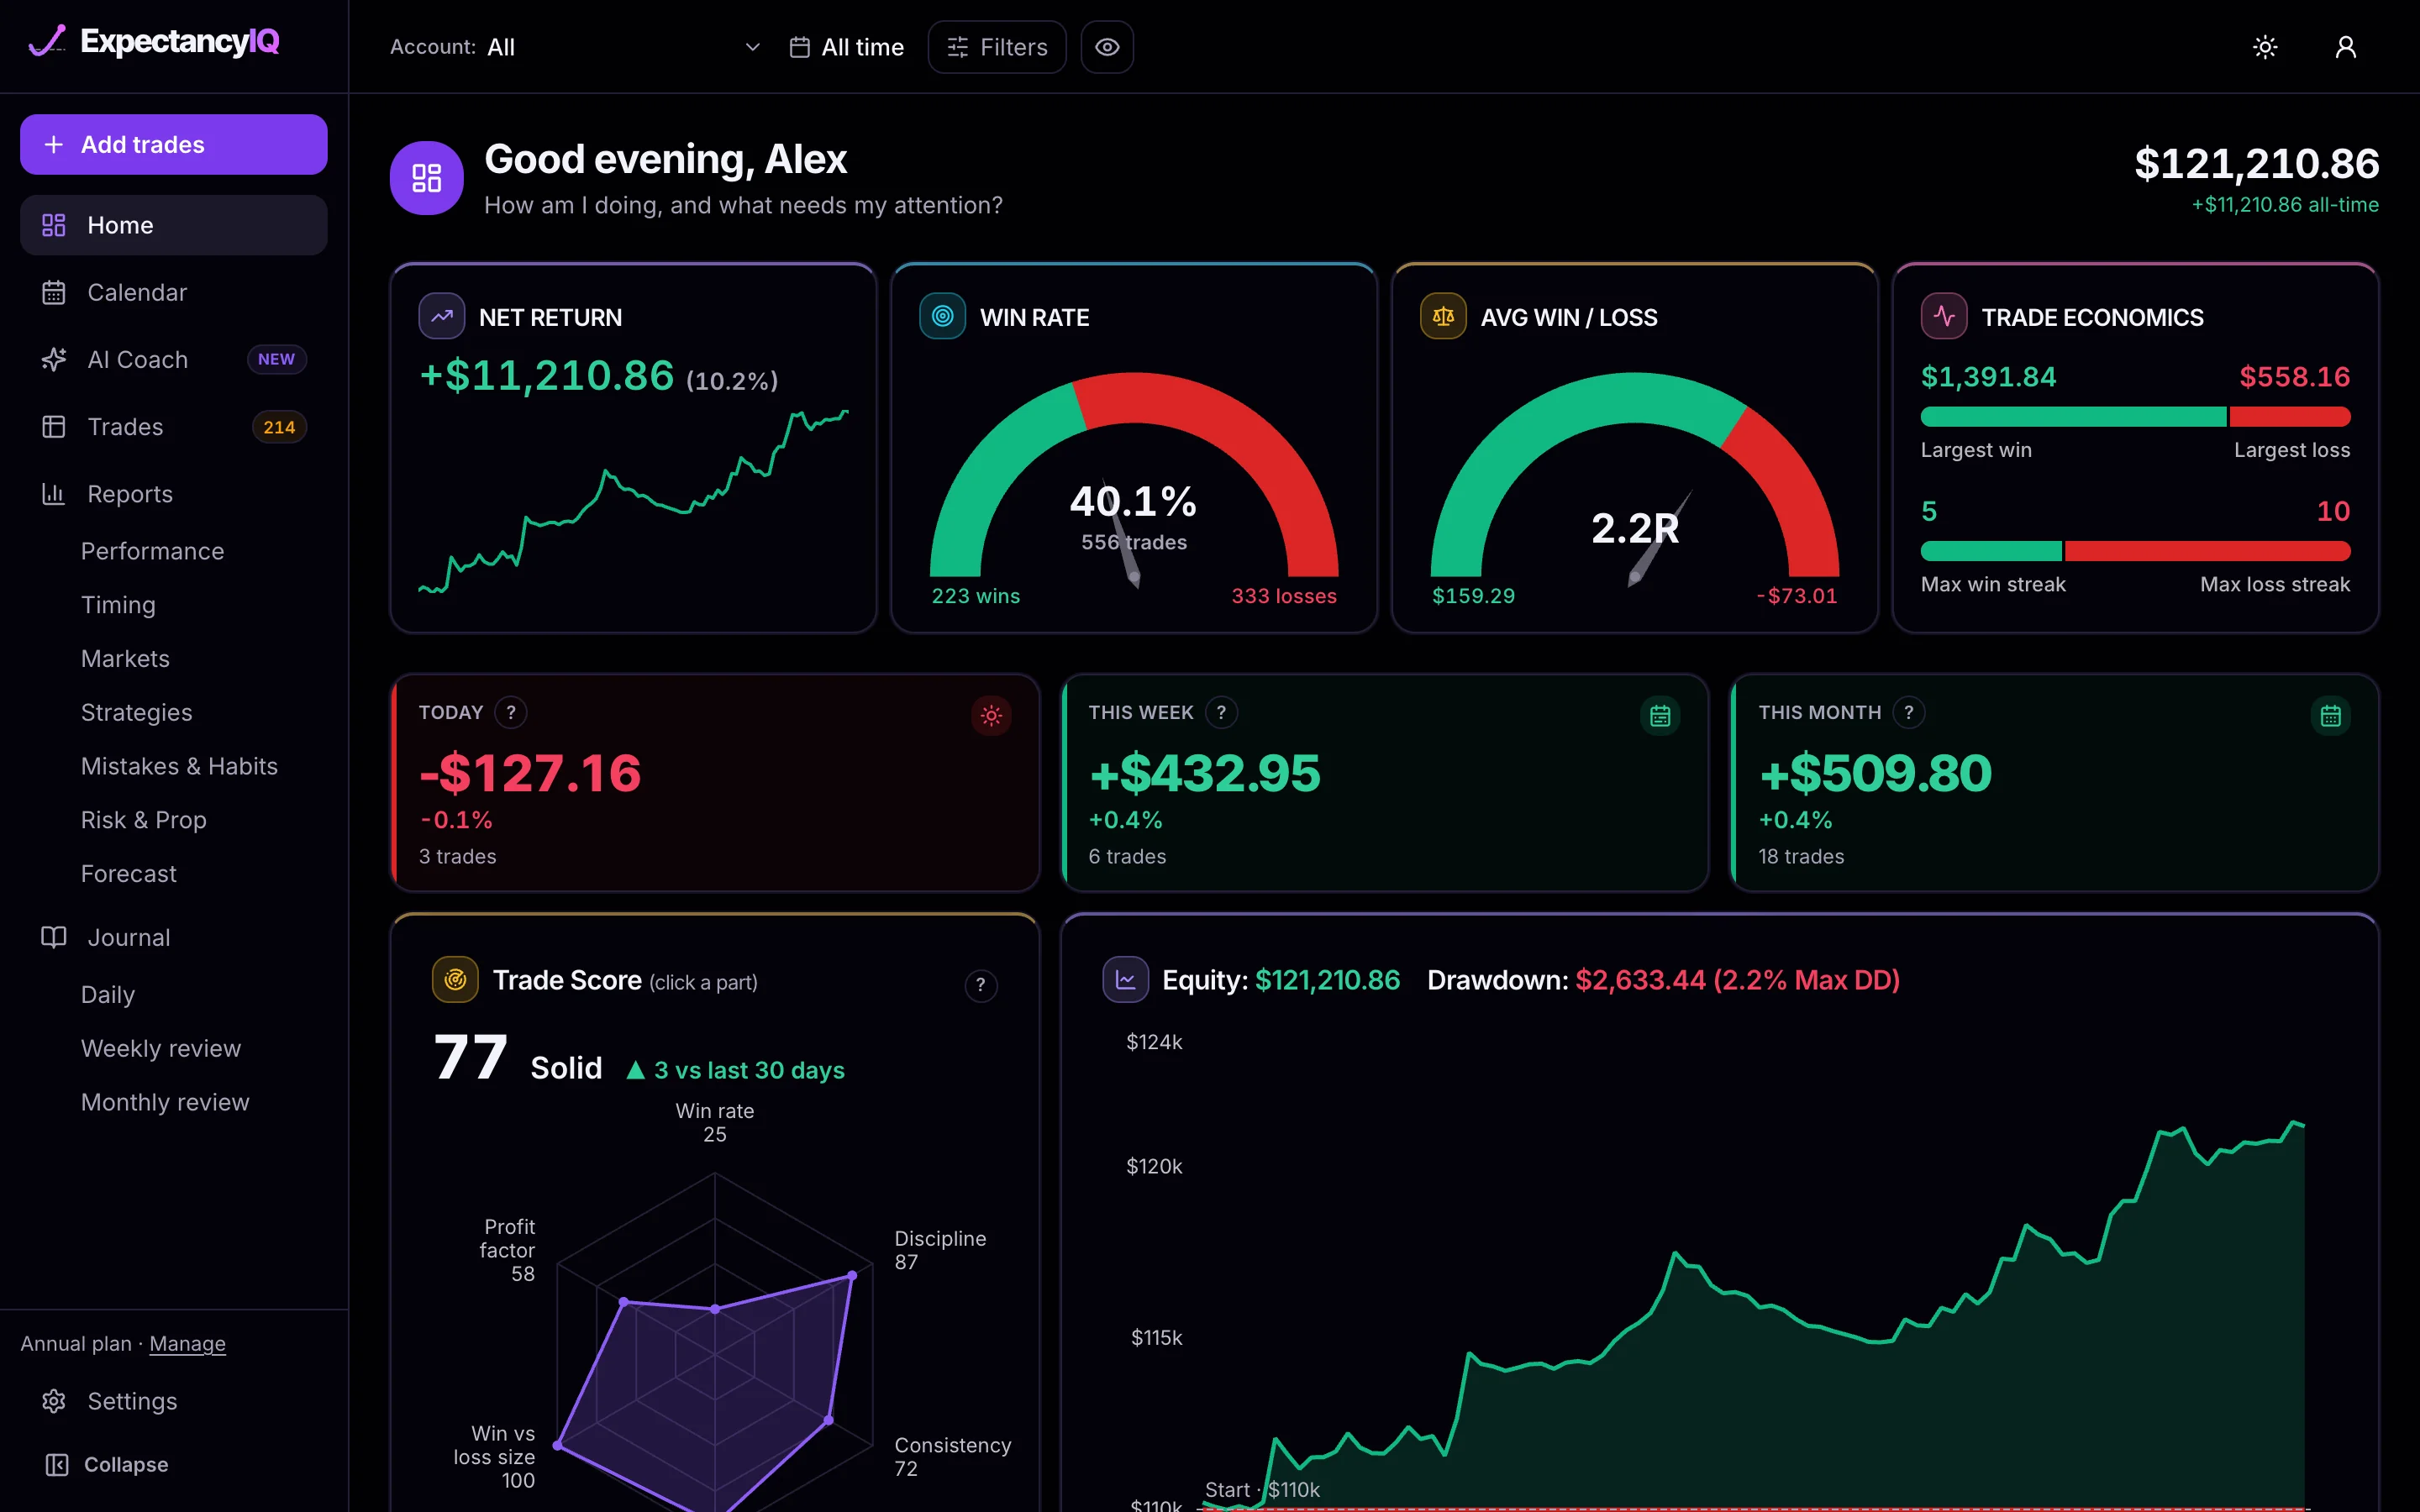
Home is the summary. When a number on it moves, the Reports explain why. There are six: Performance, Timing, Strategies, Markets, Mistakes & Habits, and Risk & Prop, with 43 charts on the free trial and all 53 on Pro. Performance is where the edge is tested: profit factor, expectancy and recovery factor, Sharpe, Sortino and Calmar ratios, month-by-month results and a rolling 20-trade window.

Performance report on the sample account: best and worst month, profitable months, profit factor 1.46, expectancy 0.28, Sharpe 4.04, Sortino 11.58 and Calmar 11.97
The Performance report: trade quality and system quality for the same sample trades.

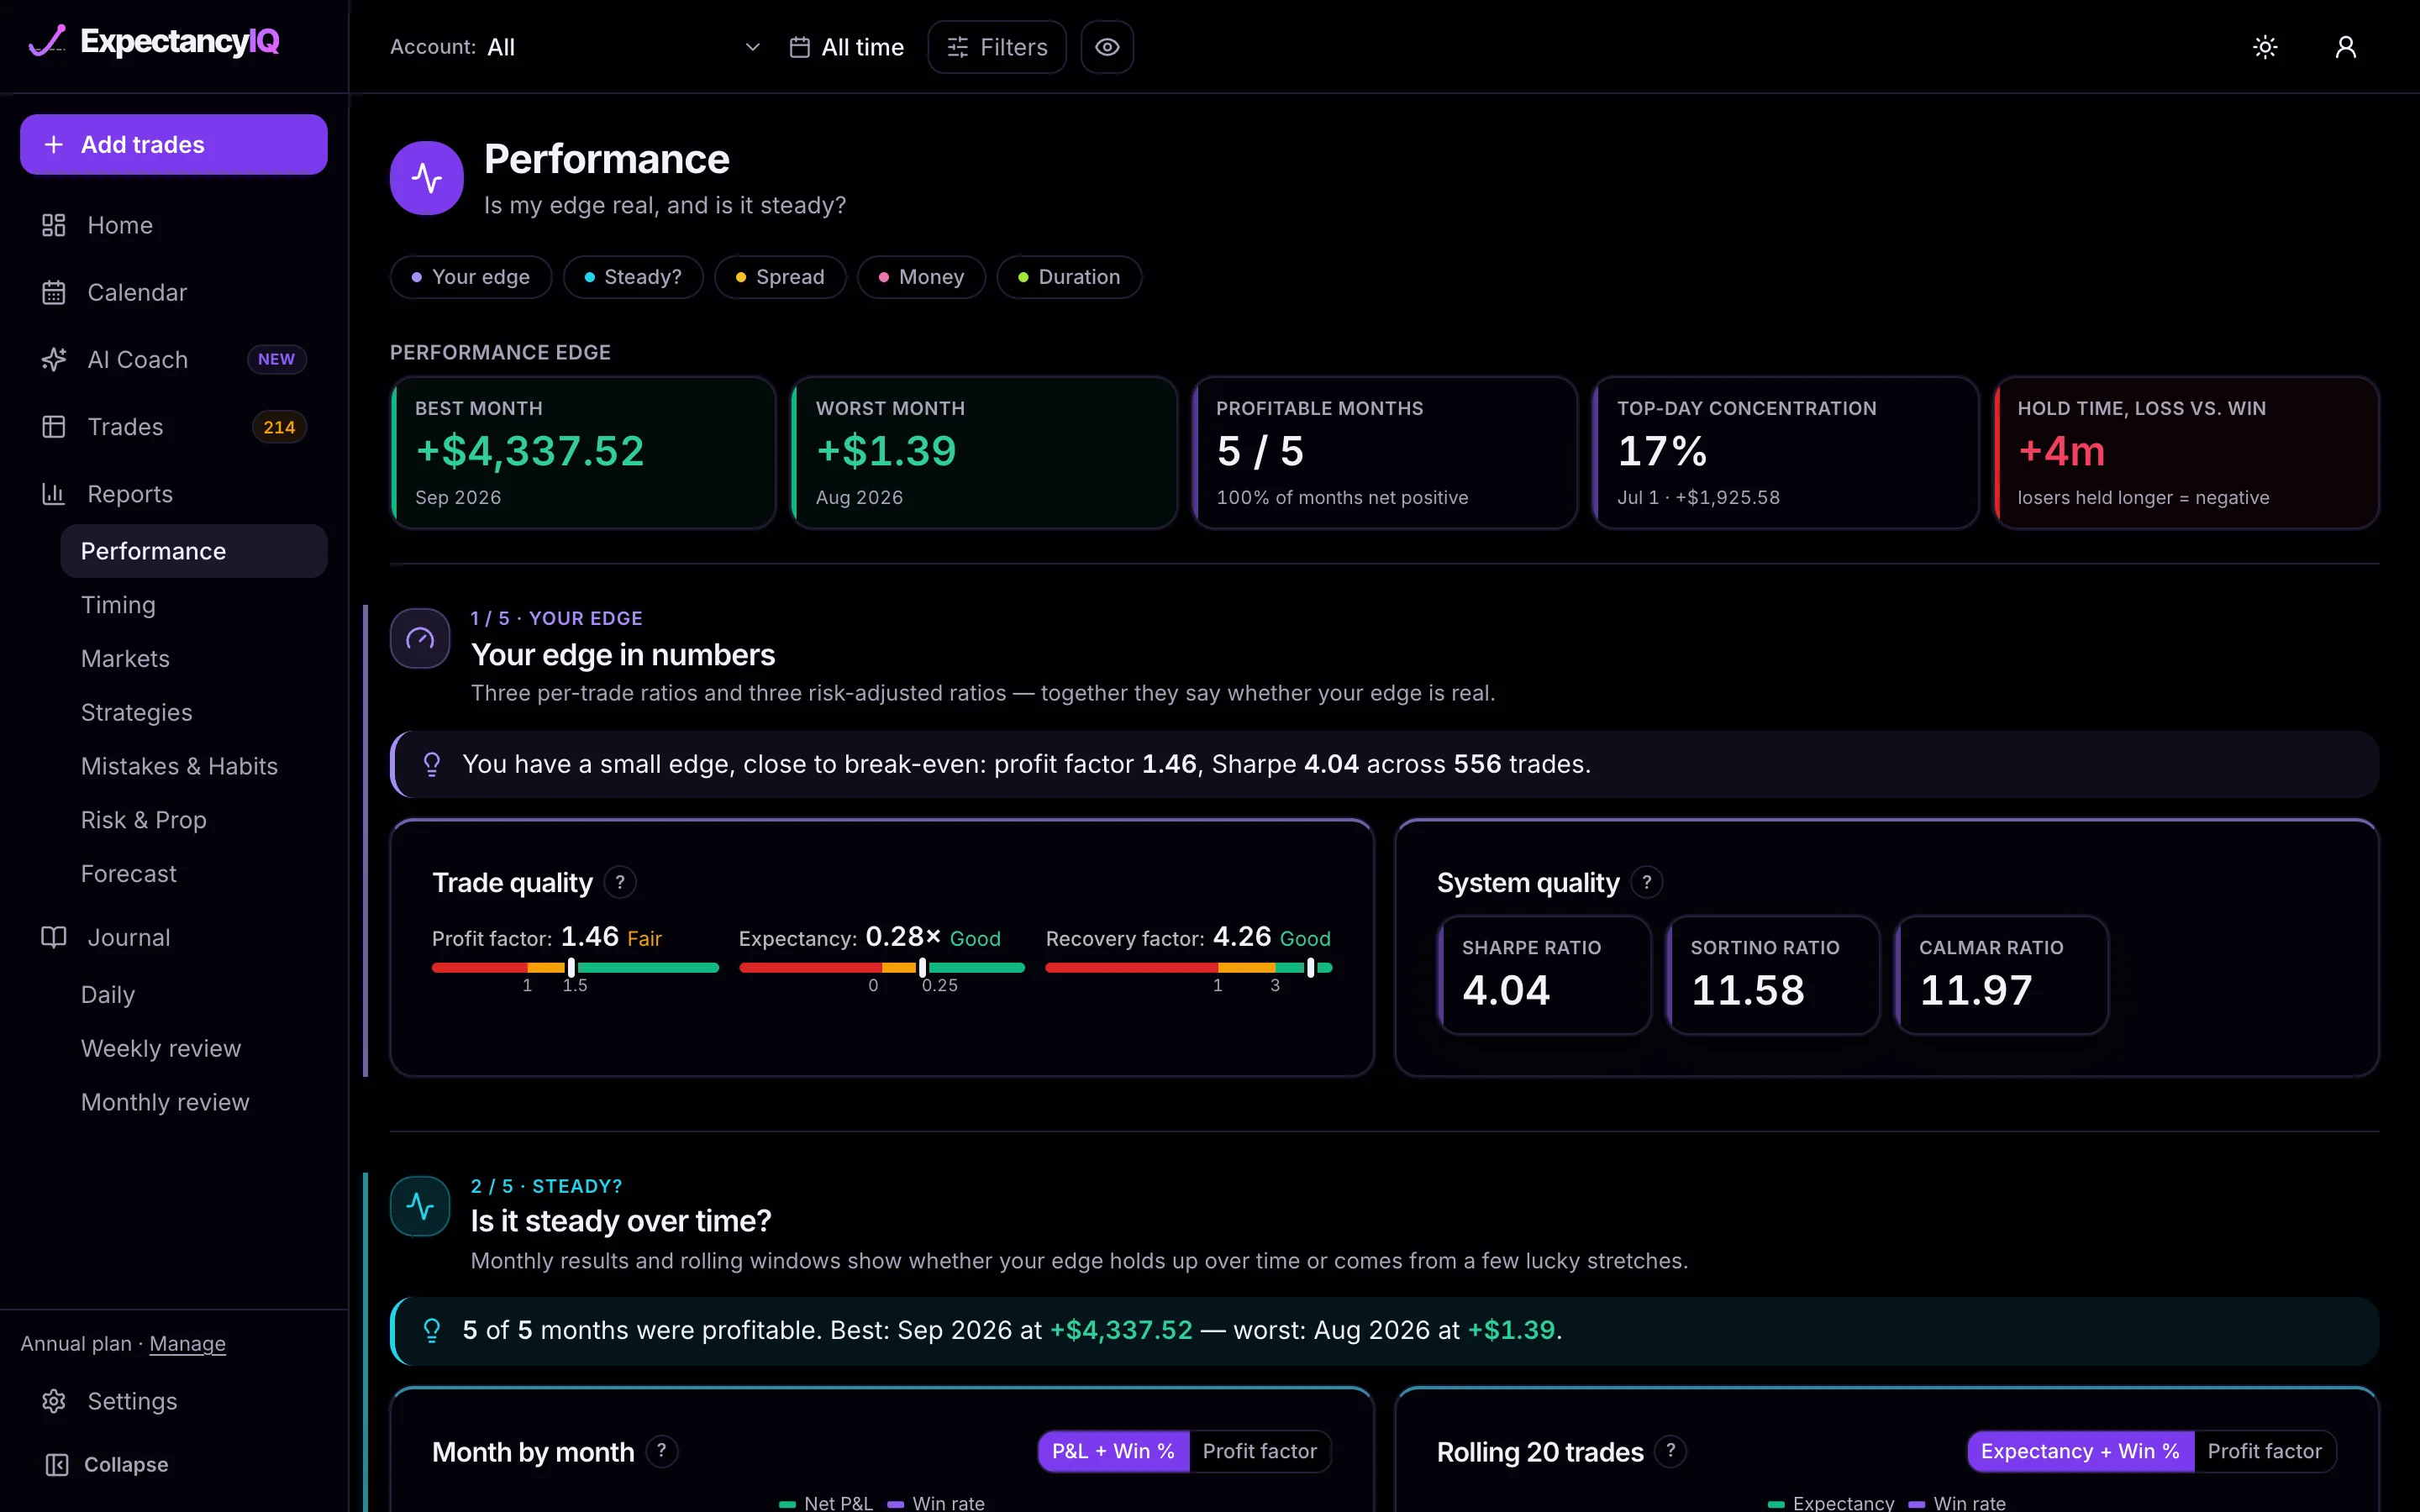
The Calendar shows the same trades by day, with a total for each week, so you can see whether a good month came from steady days or from one lucky session. Prop firm traders get a Risk & Prop report that checks every trade against their firm's drawdown, daily loss and consistency rules; more on that for prop and funded traders.

P&L calendar for September 2026 on the sample account: green and red days with trade counts, weekly totals down the right and a monthly summary of 132 trades at a 35% win rate
The P&L Calendar for one month of the sample account.

A trading dashboard vs a spreadsheet or Notion template

Search for a trading dashboard and most results are templates and mock-up images. A template can look like a dashboard, but you type every trade into it, and the formulas break the first time a partial fill, a commission or a futures session that crosses midnight doesn't fit the columns. We compared both in detail: trading journal vs Excel and trading journal vs Notion.

Your broker or prop firm probably has a dashboard too. It is accurate for P&L, but it can't tell you which setup, session or habit drives the result. That gap is covered in trading journal vs broker dashboard.

Set up your trading dashboard

  1. Create an account. No credit card. Until you import, Home shows the sample account so you can click through every card.
  2. Add a trading account in Settings with its currency and starting balance. Drawdown and % return are measured from that balance.
  3. Import a CSV. Tradovate, NinjaTrader, cTrader and Topstep files are detected automatically. Any other broker works through the generic CSV options, and cTrader can sync on its own on Pro.
  4. Use the account and date filters at the top to look at one account or one period. Home, the Calendar and the Reports all follow them.

The dashboard is part of the ExpectancyIQ trading journal. This page is educational, not financial advice; see the risk disclosure.
Trading dashboard questions

What should a trading dashboard include?

At minimum: net P&L and return, win rate, average win against average loss, and an equity curve with drawdown. Those four tell you whether you make money and how much pain it costs. A useful dashboard also splits results by period, so today and this week are visible without filtering, and flags the trades you haven't reviewed yet.

What is the difference between a trading dashboard and a trading journal?

A dashboard summarises results. A journal records each trade: the setup, the plan, how you executed it and how you felt. In ExpectancyIQ both run on the same imported trades, so a note or mistake tag you add in the journal shows up in the reports, and the dashboard figures always match the trade list.

Why do I see sample data on my Dashboard?

Any account with zero imported trades shows deterministic sample data so you can see what every chart looks like before importing. Import at least one real trade and it switches over automatically.

What brokers and platforms can I import from?

Tradovate (completed trades or raw fills), NinjaTrader, cTrader, and Topstep (TopstepX) are natively supported with auto-detection — and cTrader can skip the export entirely by connecting the account for automatic sync (paid plans). Generic CSV, Generic CSV (Entry/Exit + Side), and Generic CSV (Fills) cover everything else via manual column mapping — the Fills option FIFO-matches a raw executions/order-history export from any broker into closed trades, which is how a real Black Bull Markets forex/CFD account was imported without a dedicated integration.

Is there a free trial?

Yes — every new account gets 14 days free with no credit card. After that your account stays open read-only: you can still sign in and see your trades and stats, but importing, adding or editing needs a subscription. Nothing is deleted.

Trading dashboard

See your own numbers on this screen

Import one CSV and Home fills with your net return, win rate, drawdown and Trade Score.

Free for 14 days, then read-only · Analytics only, never signals