Getting started
What do I do first?
Your first sign-inSample data until you add your own trades.
A new account opens on Home filled with sample trades, marked by a Sample data pill at the top, so you can see every chart before you import anything. Your Trades, Journal and Reviews pages stay empty until you add your own trades.
Click + Add trades at the top of the sidebar to import a CSV. As soon as an account has real trades, the sample data disappears and every page switches to your numbers.
Find your way aroundOne sidebar: Home, Calendar, AI Coach, Trades, Reports, Journal.
- Home: how you are doing and what needs attention.
- Calendar: which days and weeks made or lost money.
- AI Coach: what your trades say you should change.
- Trades: every trade, searchable, with a full review screen for each one.
- Reports: seven reports, each section answering one question.
- Journal: your daily journal, weekly review and monthly review.
Settings sits at the bottom of the sidebar. Collapse shrinks the sidebar to icons; on a phone the same pages sit in a tab bar along the bottom.
Install the appPut ExpectancyIQ on your phone, tablet or computer.
ExpectancyIQ installs straight from your browser, with no app store: it gets its own icon and opens full screen, with the same account and data. On iPhone, tap Share then Add to Home Screen. On Chrome or Edge, use Install app in the account menu.
Get the app has the steps for every device.
FiltersAccount, date range and more, shared across pages.
The bar across the top of Home, Calendar, Trades and Reports sets which trades you are looking at: the Account, the date range (All time by default) and Filters for strategy, symbol, direction, session, result and more. A filter you set follows you from page to page, and Clear resets it.
The eye button hides trades you have tagged excluded, such as test or mistaken fills, from every figure. The AI Coach always reads all of your trades, so its pages have no filter bar.
Free trial and Pro14 days free, then read-only. Pro adds the AI Coach.
The trial lasts 14 days with no credit card: 1 trading account, CSV import, Home, Calendar, the Trade Score, 43 report charts, prop-firm rules and the full journal. Stats cover your last 60 days, the first 2 insights show in full, and you can add 20 screenshots a month.
After 14 days your account stays open read-only: you can sign in and see everything, but not import, add or edit until you upgrade. Pro adds the AI Coach, all-time stats, all 53 charts including Forecast, every insight, automatic cTrader sync and up to 5 accounts. See Pricing for the full comparison.
Importing
How do my trades get in?
Supported filesTradovate, NinjaTrader, cTrader, Topstep or any broker CSV.
- Tradovate: the completed trades export, or the raw fills export, which is matched into trades for you (first in, first out).
- NinjaTrader: the Trades grid export.
- cTrader: the trade history export.
- Topstep: the TopstepX export.
- Generic CSV: any other broker. Pick the shape that matches your columns: buy and sell prices, or entry and exit price with a separate side column.
Trades come in only by import or cTrader sync; there is no form to type a trade in by hand.
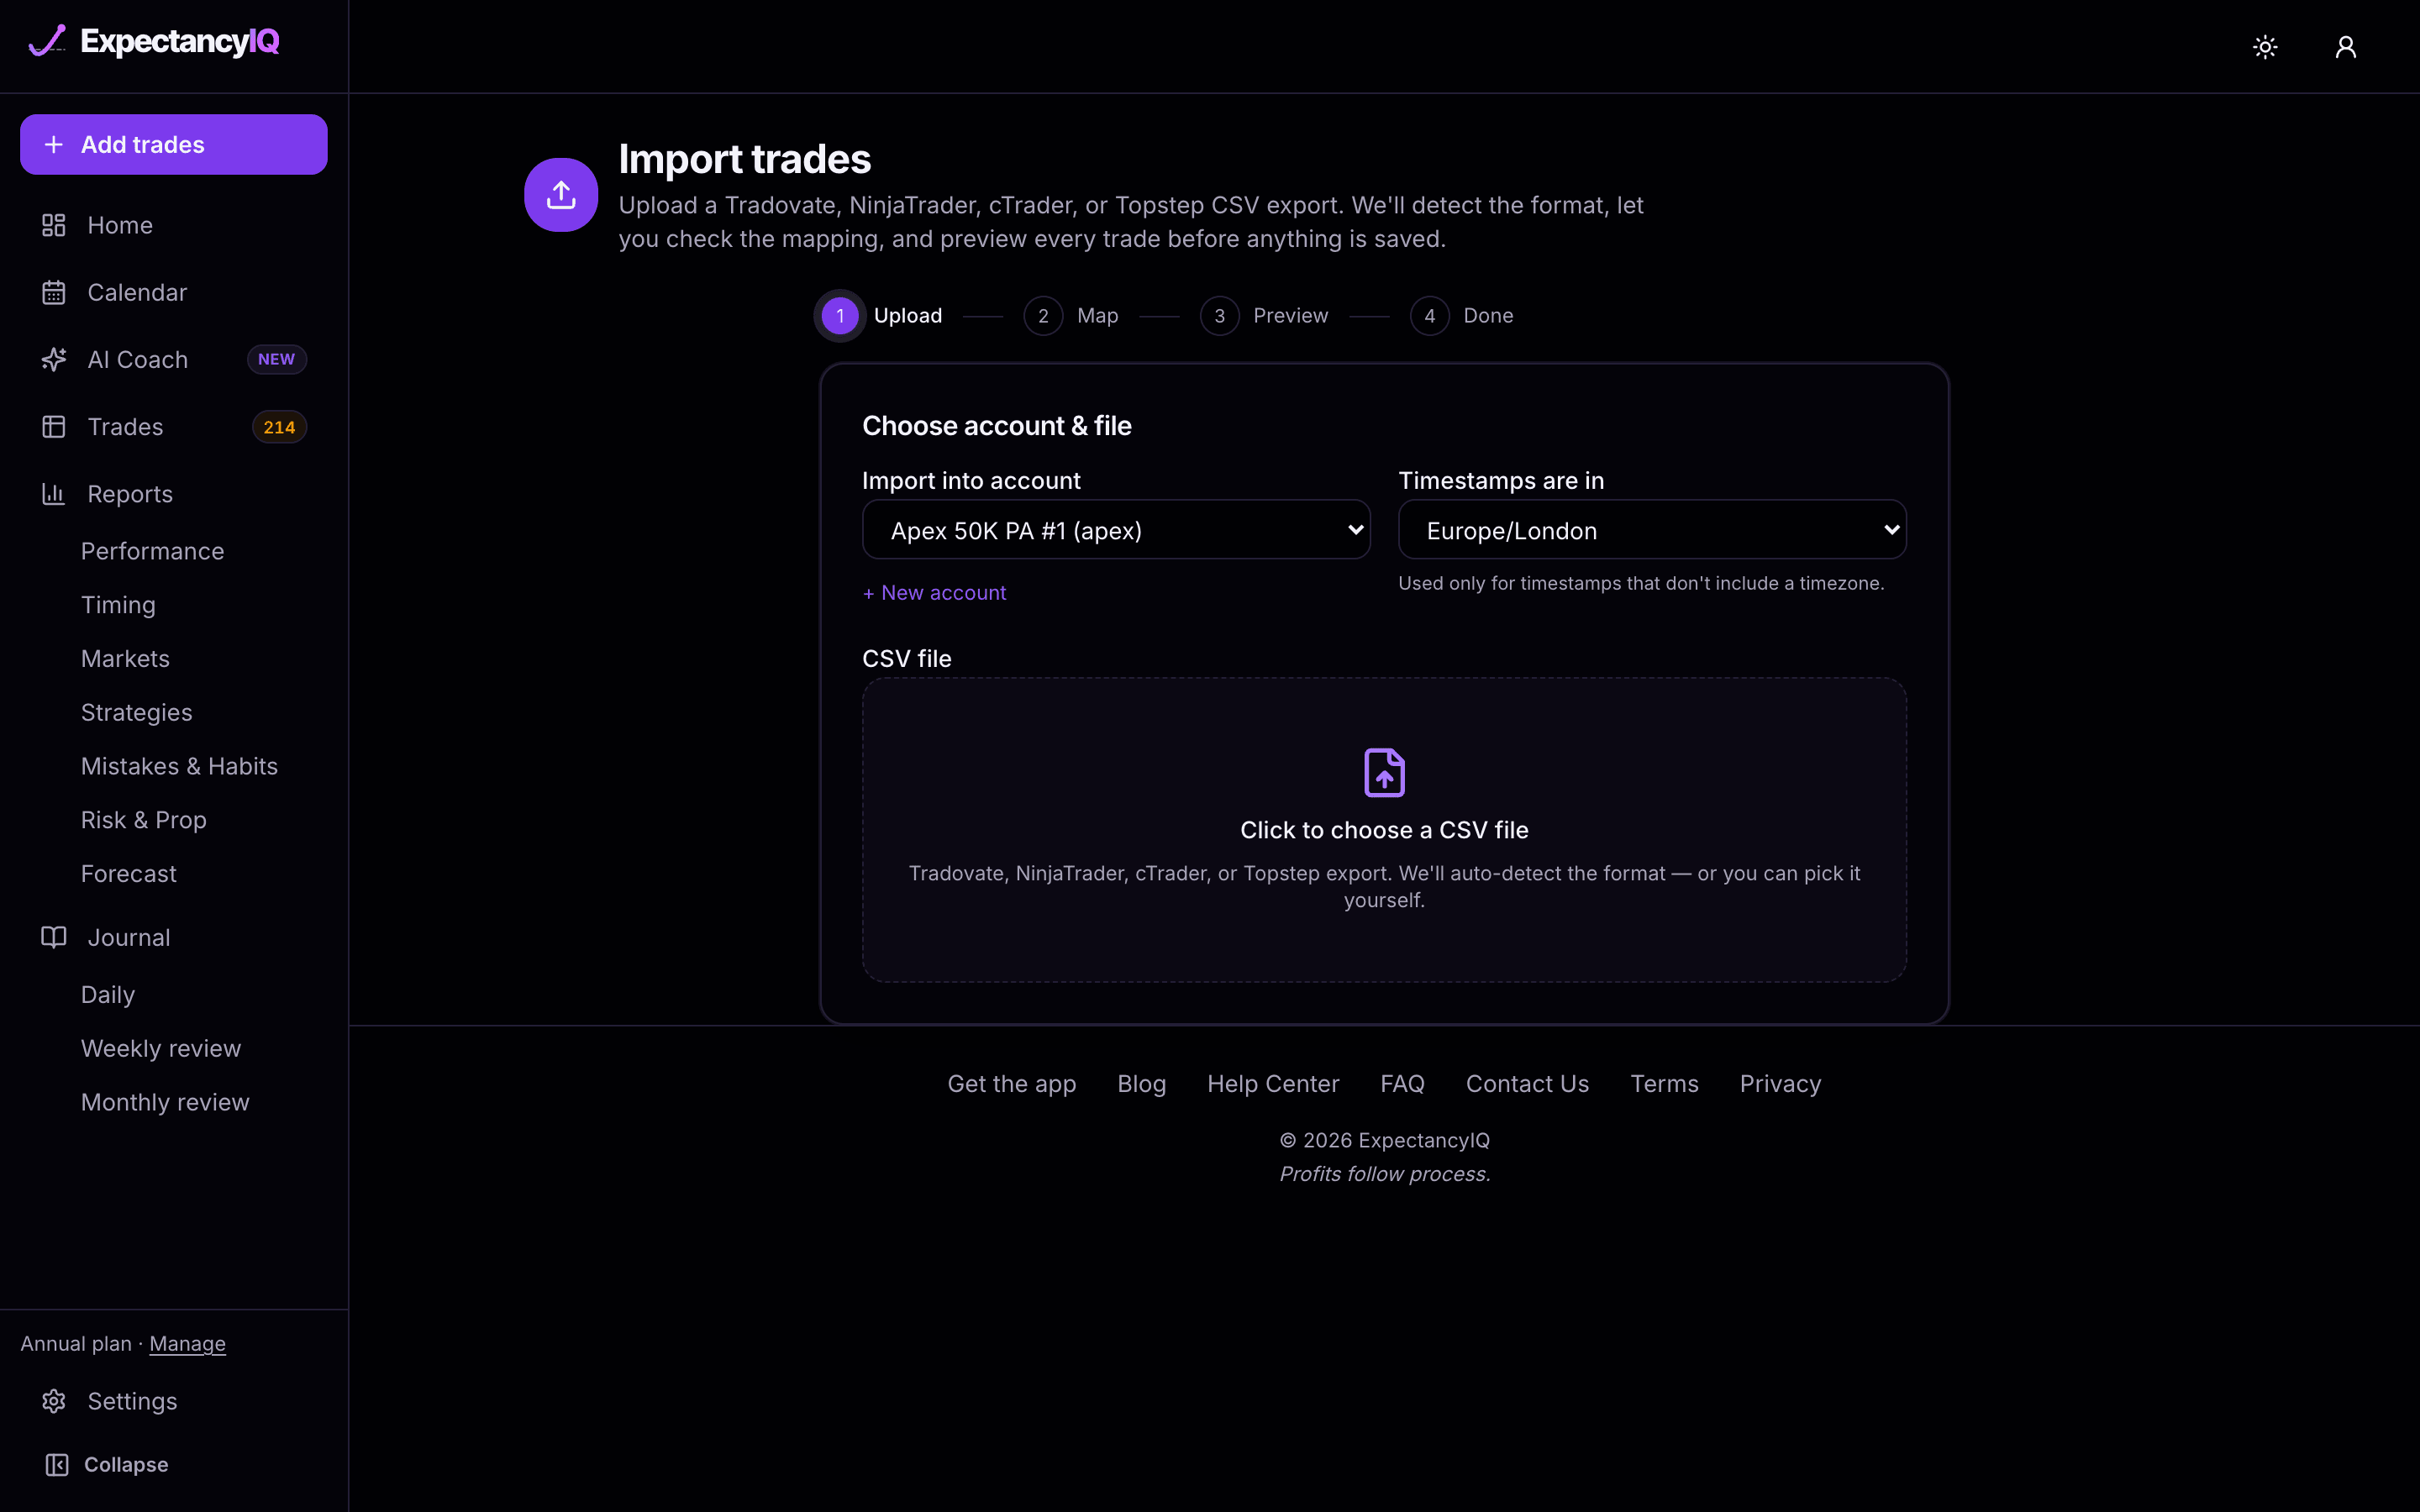
The four import stepsUpload, Map, Preview, Done.
- Upload: choose the account (or create one), the timezone for timestamps that carry none, and the CSV. The platform is detected from the column headers.
- Map: check each column lines up with the right field. Required fields are marked; you can't continue until they are all mapped.
- Preview: every parsed trade, plus any rows that failed and why, before anything is saved.
- Done: the trades are saved and every page updates.
Fixing import errorsWhy a row fails, and how duplicates are handled.
The Preview step shows the reason for every failed row. The usual causes:
- A missing symbol, quantity, price or time column.
- A quantity or price of zero or blank.
- An exit time earlier than the entry time.
- A P&L figure that doesn't match what the contract's tick value gives: check the export for an edited value.
- An unknown contract symbol with no P&L column to fall back on.
Duplicate rows inside one file are skipped. A file that overlaps trades you already imported from a different source warns you before saving, so the same trades aren't counted twice.
Undo an importSettings → Import History removes one import's trades.
Every import is listed under Settings → Import History with its file, account and trade count. Undo removes exactly the trades that import added; nothing else changes. To get a template for your own spreadsheet, use Export CSV on the Trades page: the file it makes can be imported back.
Automatic cTrader sync (Pro)Connect once; closed trades arrive on their own.
On Pro, connect a cTrader account under Settings → Trading Accounts → cTrader Sync. Access is read-only. The first sync brings in your existing history, then closed trades sync when you open the app and daily in the background, with commission and swap included. Trades you already imported by CSV aren't counted twice.
Home
How am I doing, and what needs my attention?
Headline numbersNet return, win rate, average win and loss, trade economics.
The top row shows your net return with its curve, win rate, average win against average loss (in R and money) and trade economics: largest win and loss, longest winning and losing streaks. Below it, Today, This week and This month show the P&L and trade count for each period.
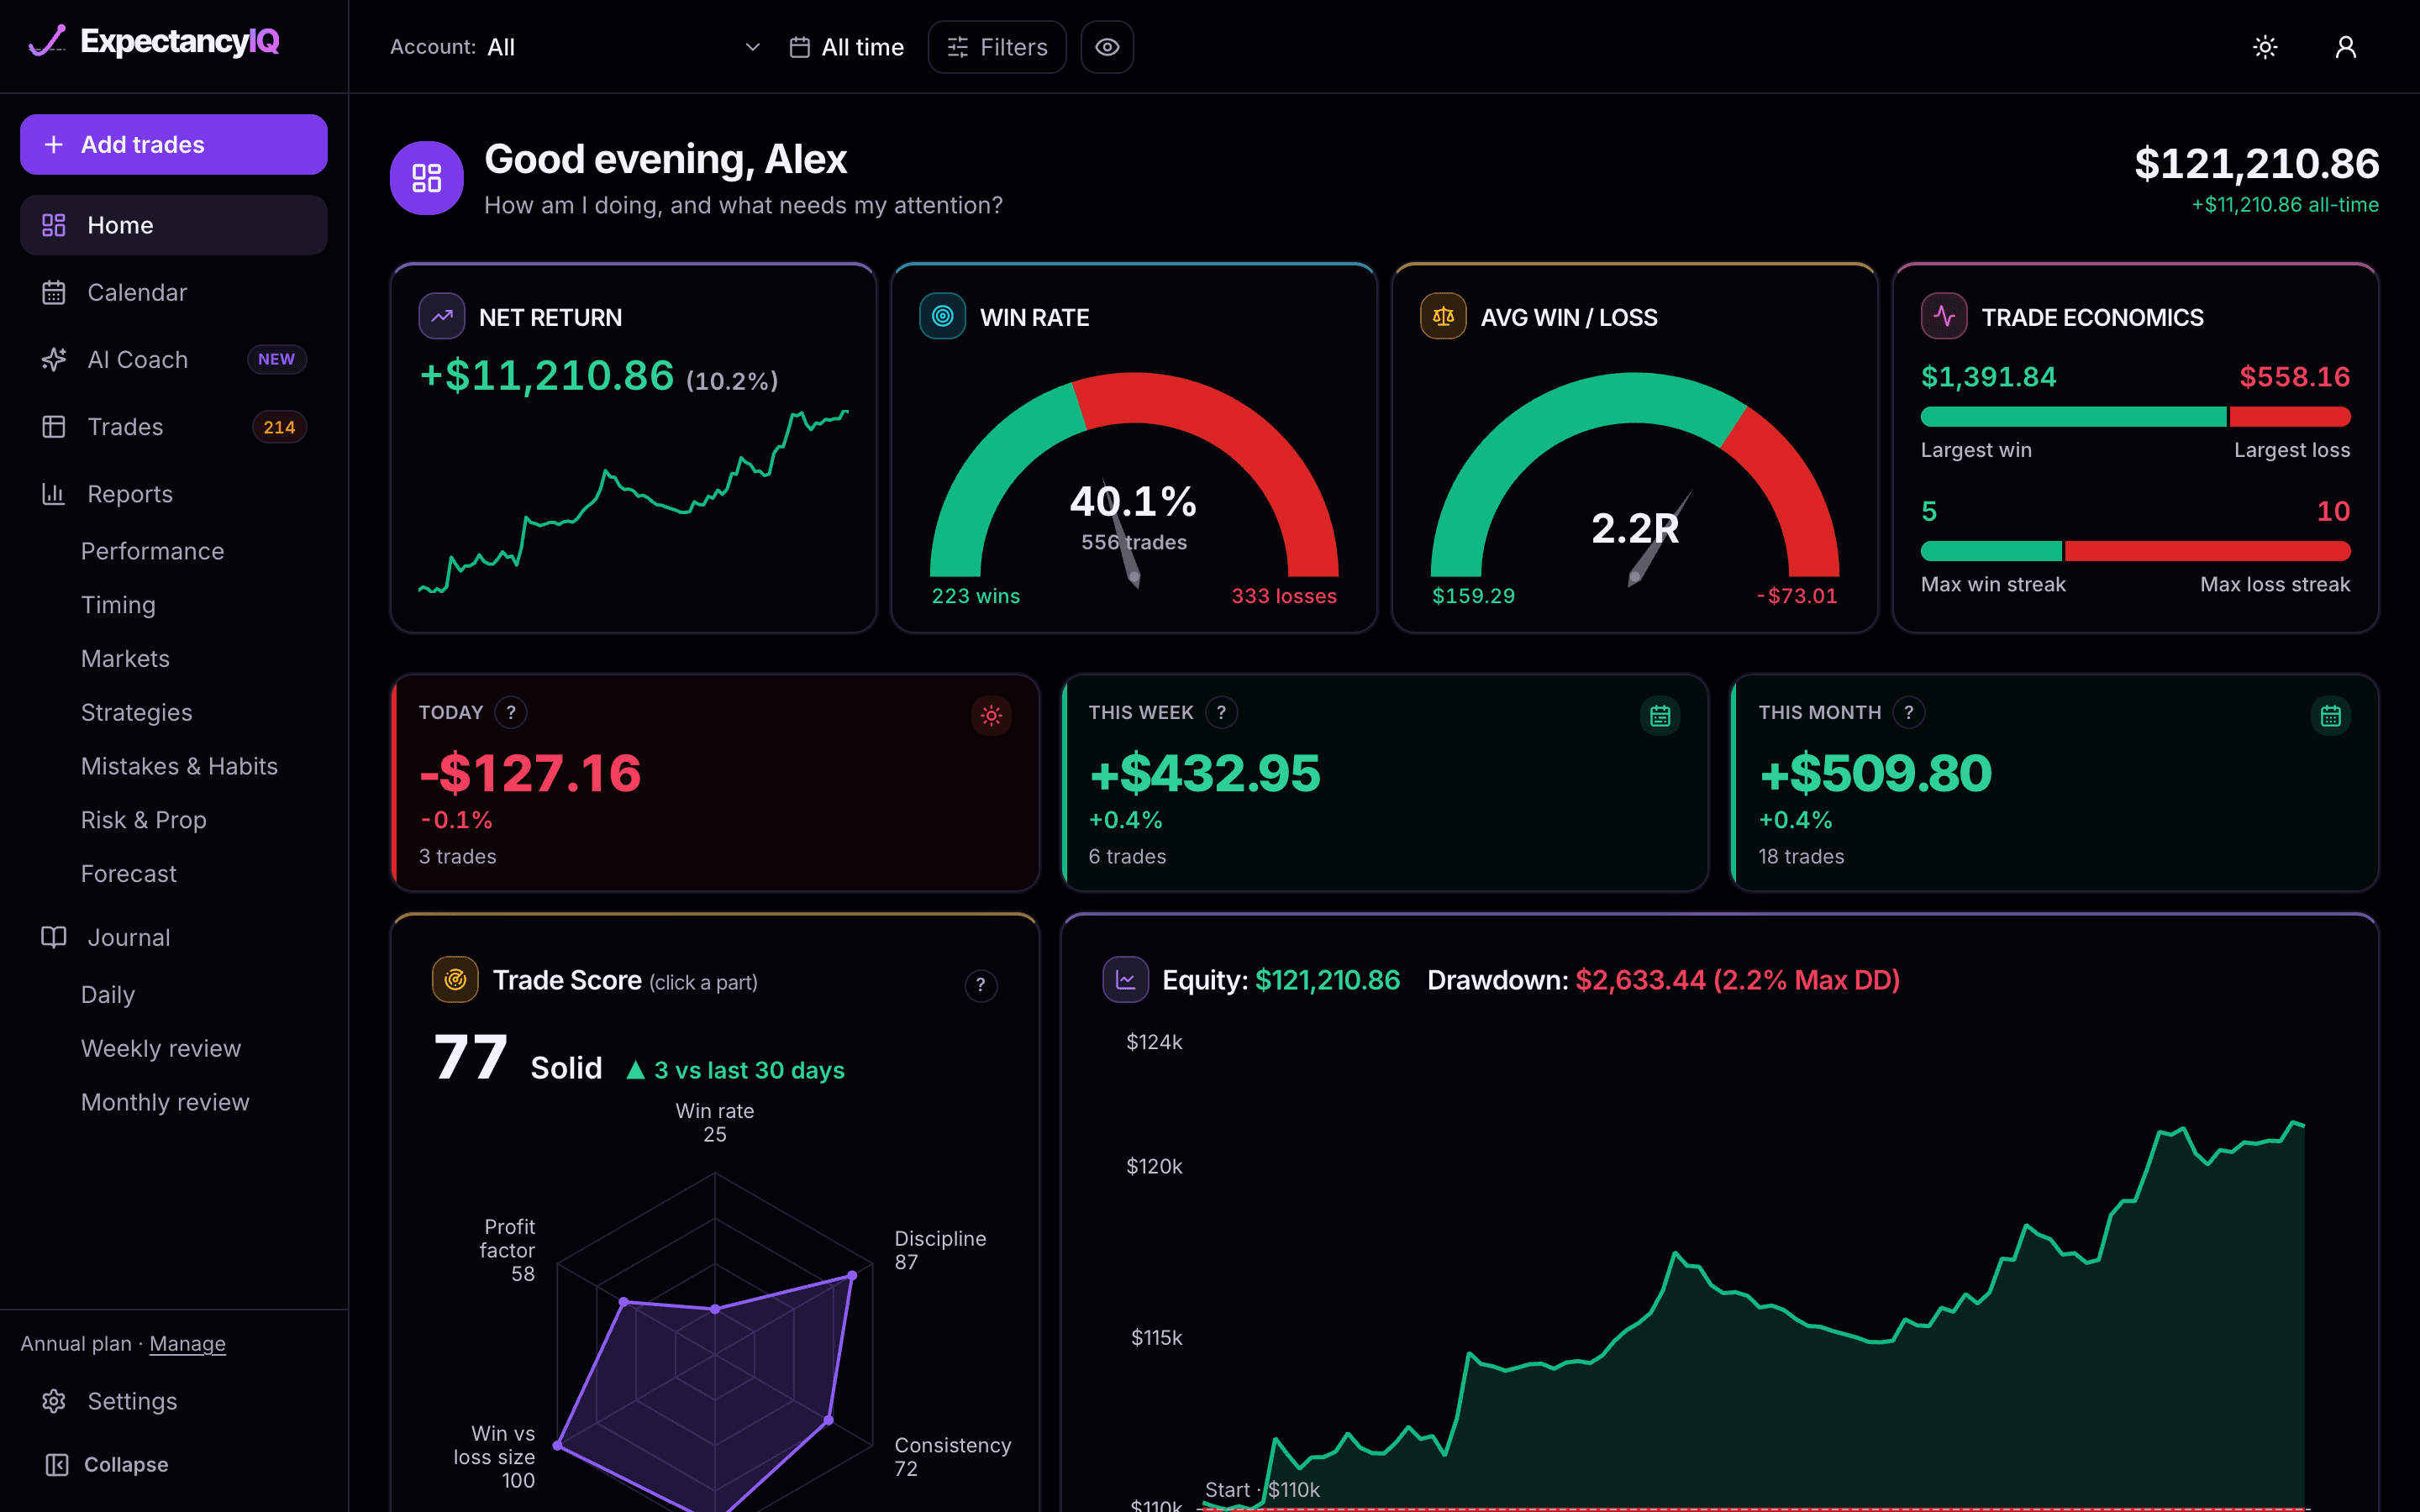
Trade ScoreOne 0–100 rating of your edge, from six parts.
The Trade Score rates your edge from 0 to 100 across six parts: win rate, profit factor, win vs loss size, drawdown control, consistency and discipline (clean trades, loss-limit breaches, tilt, oversizing, reviewed trades and rules followed). It reads Weak, Developing, Solid or Strong, and shows its change over the last 30 days.
Click any part of the chart to see the figures behind it. A losing trader is capped at 59, so the score never calls a losing record strong. The methodology page explains every formula.
Equity and drawdownYour balance over time, green above the start and red below.
The equity curve shows your balance after every trading day, coloured green above your starting balance and red below it. The header reads your current equity and your largest drawdown in money and percent. Deposits and withdrawals you record in Settings move the balance but never the trading figures.
AI Coach note and recent activityYour top strengths and leaks, plus recent trades, weeks and days.
The AI Coach note shows your AI summary (Pro) and the strongest insight cards: your best session, best strategy and costliest mistake, each with its estimated money impact. Recent trades, Recent weeks and Recent days list your latest results; click any of them to open the detail.
Calendar
Which days and weeks made or lost money?
Month grid and week totalsEvery day coloured by P&L, with a total for each week.
Each day shows its P&L and trade count, green for a profit and red for a loss, and the Week column adds up that month's days. The monthly summary beside it gives the month's P&L, trades, win rate and winning and losing days. Use the arrows to move between months.
The four tiles at the top always show today, this week, this month and this quarter, whatever month you have open.
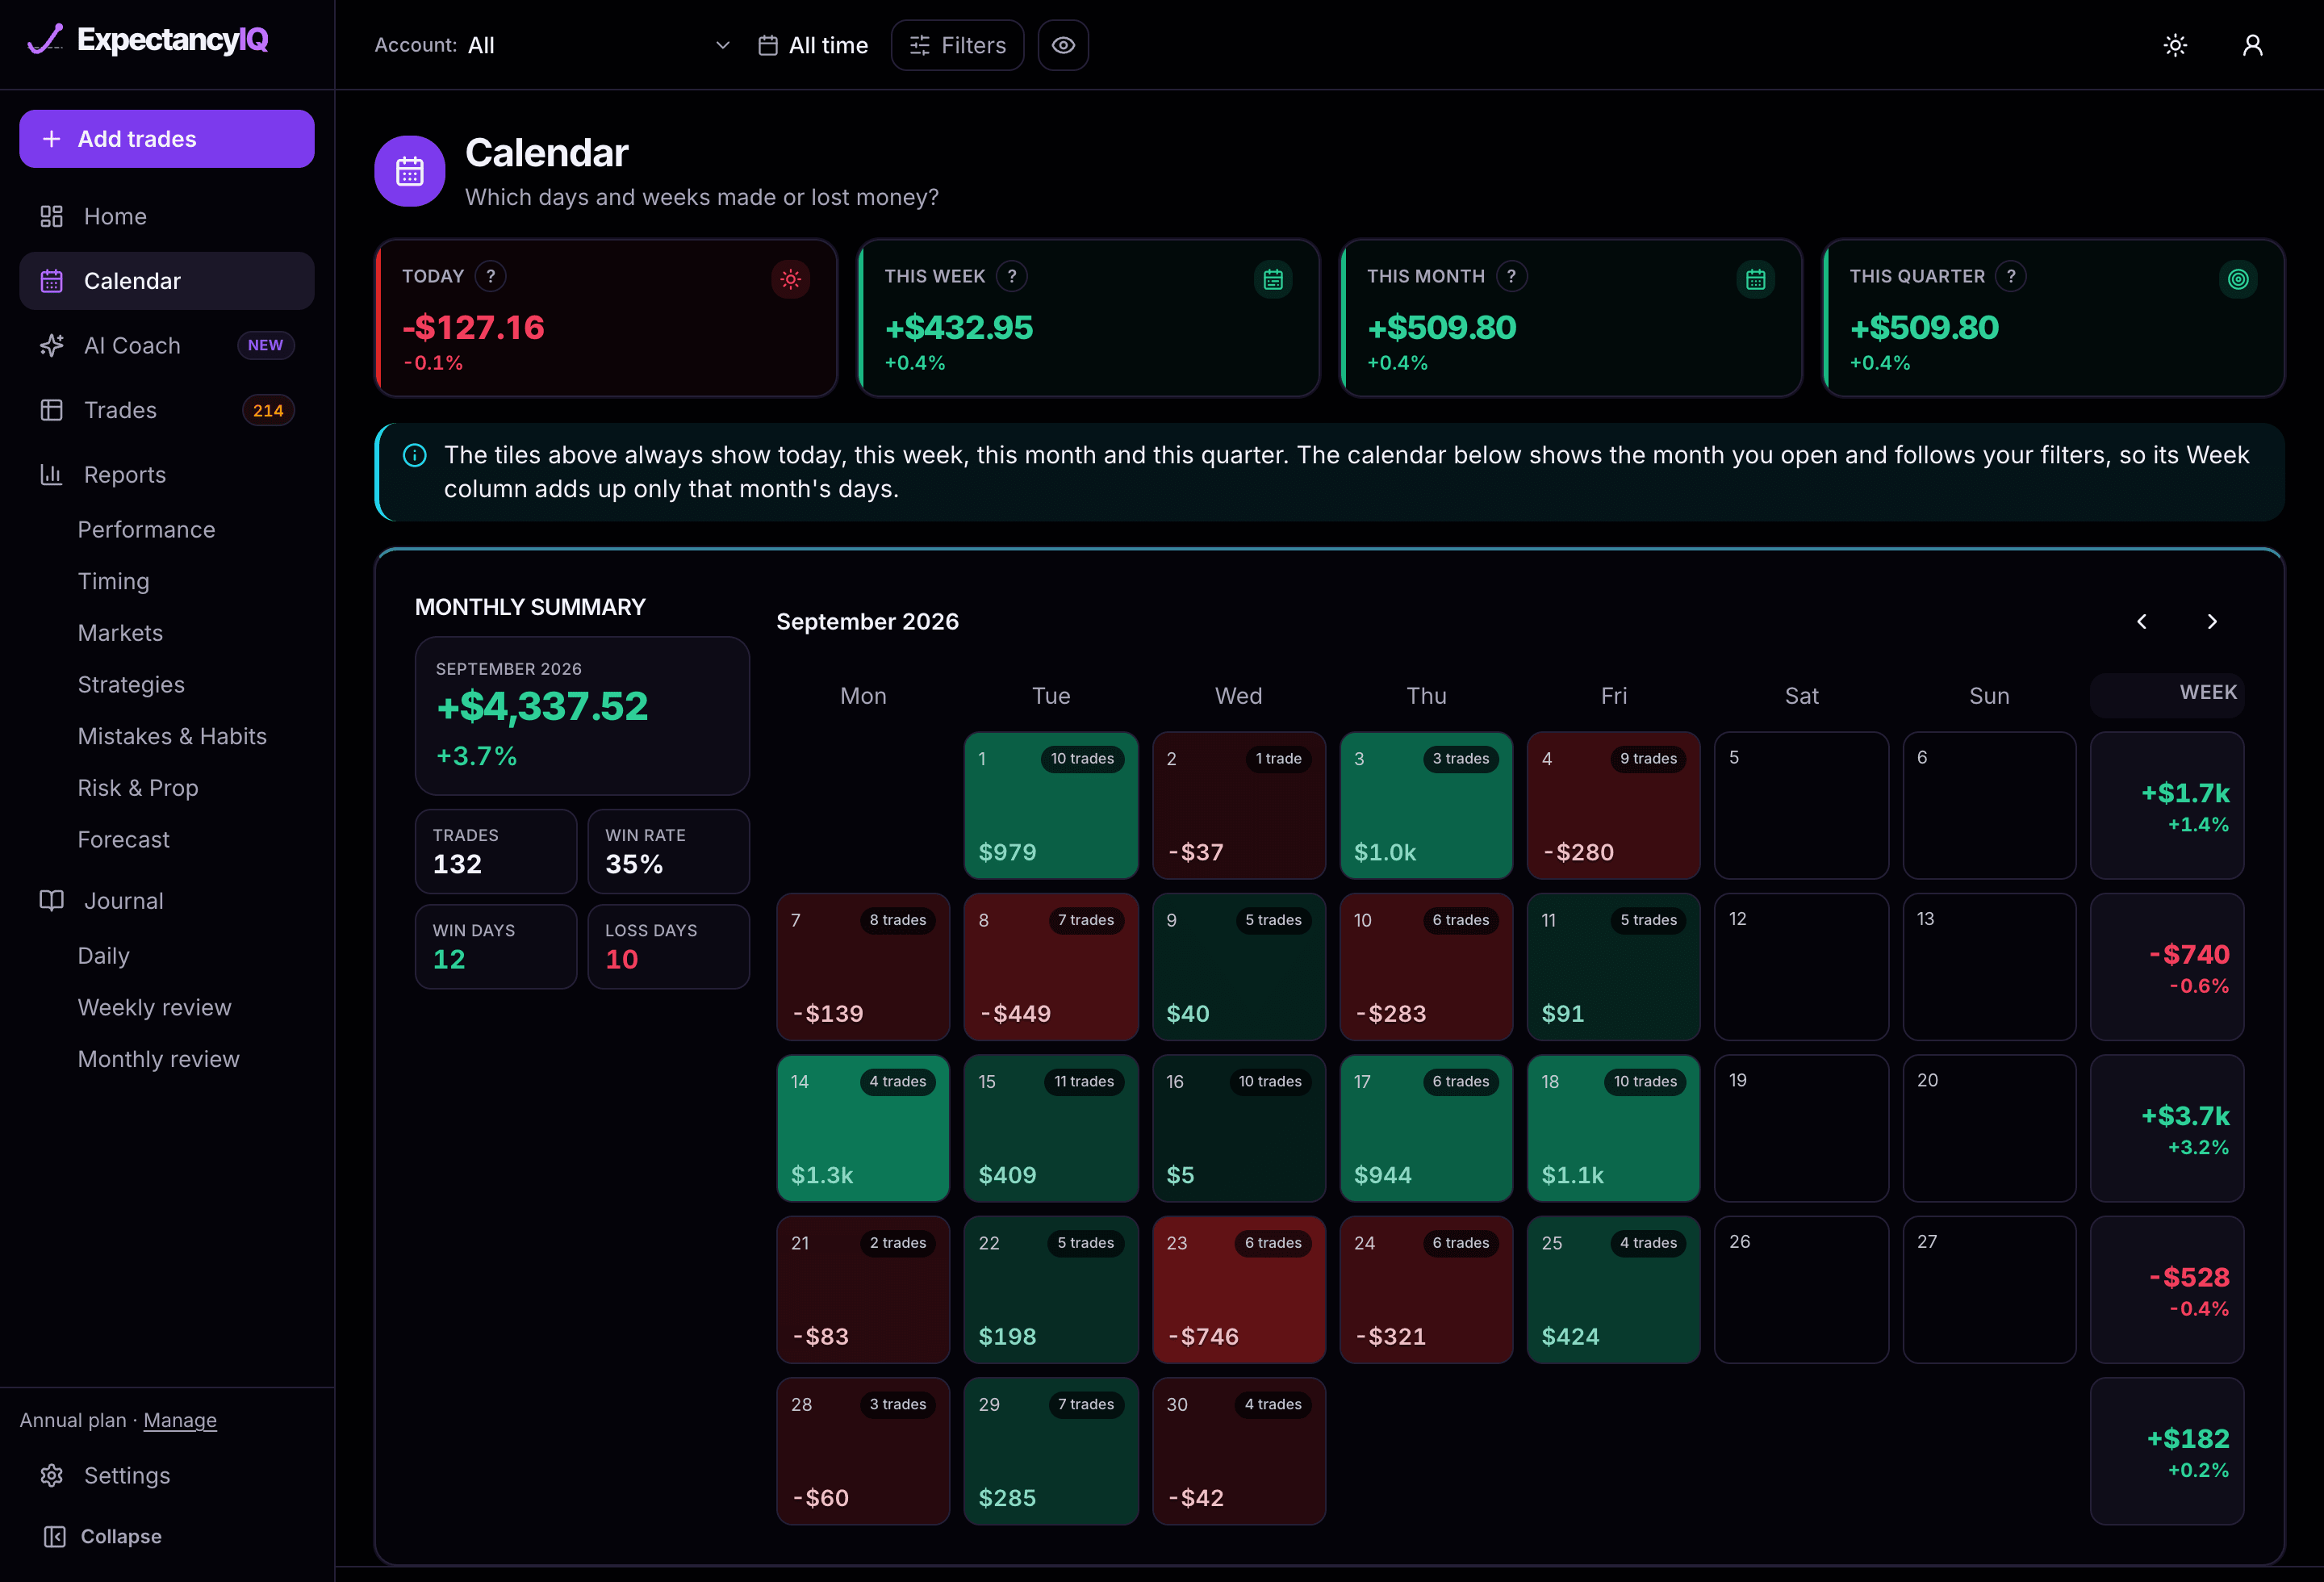
Open a day's tradesClick a day to see exactly the trades behind it.
Click any day with trades and Trades opens filtered to that day. The one-day filter is temporary: when you leave Trades, your previous date range comes back.
Trades
What happened on each trade?
The trades listSearch, quick filters, totals and a by-day view.
Trades lists every trade with its symbol, side, size, net P&L, R, strategy, mistakes and review status. The quick filters All, Winners, Losers and Needs review sit above the table, next to a search box for symbols, notes and tags. The strip above the table totals whatever is showing: trades, net P&L, win rate, average R and costs.
Switch List to By day to group trades under each trading day, choose which columns show with Columns, and download the current view with Export CSV.
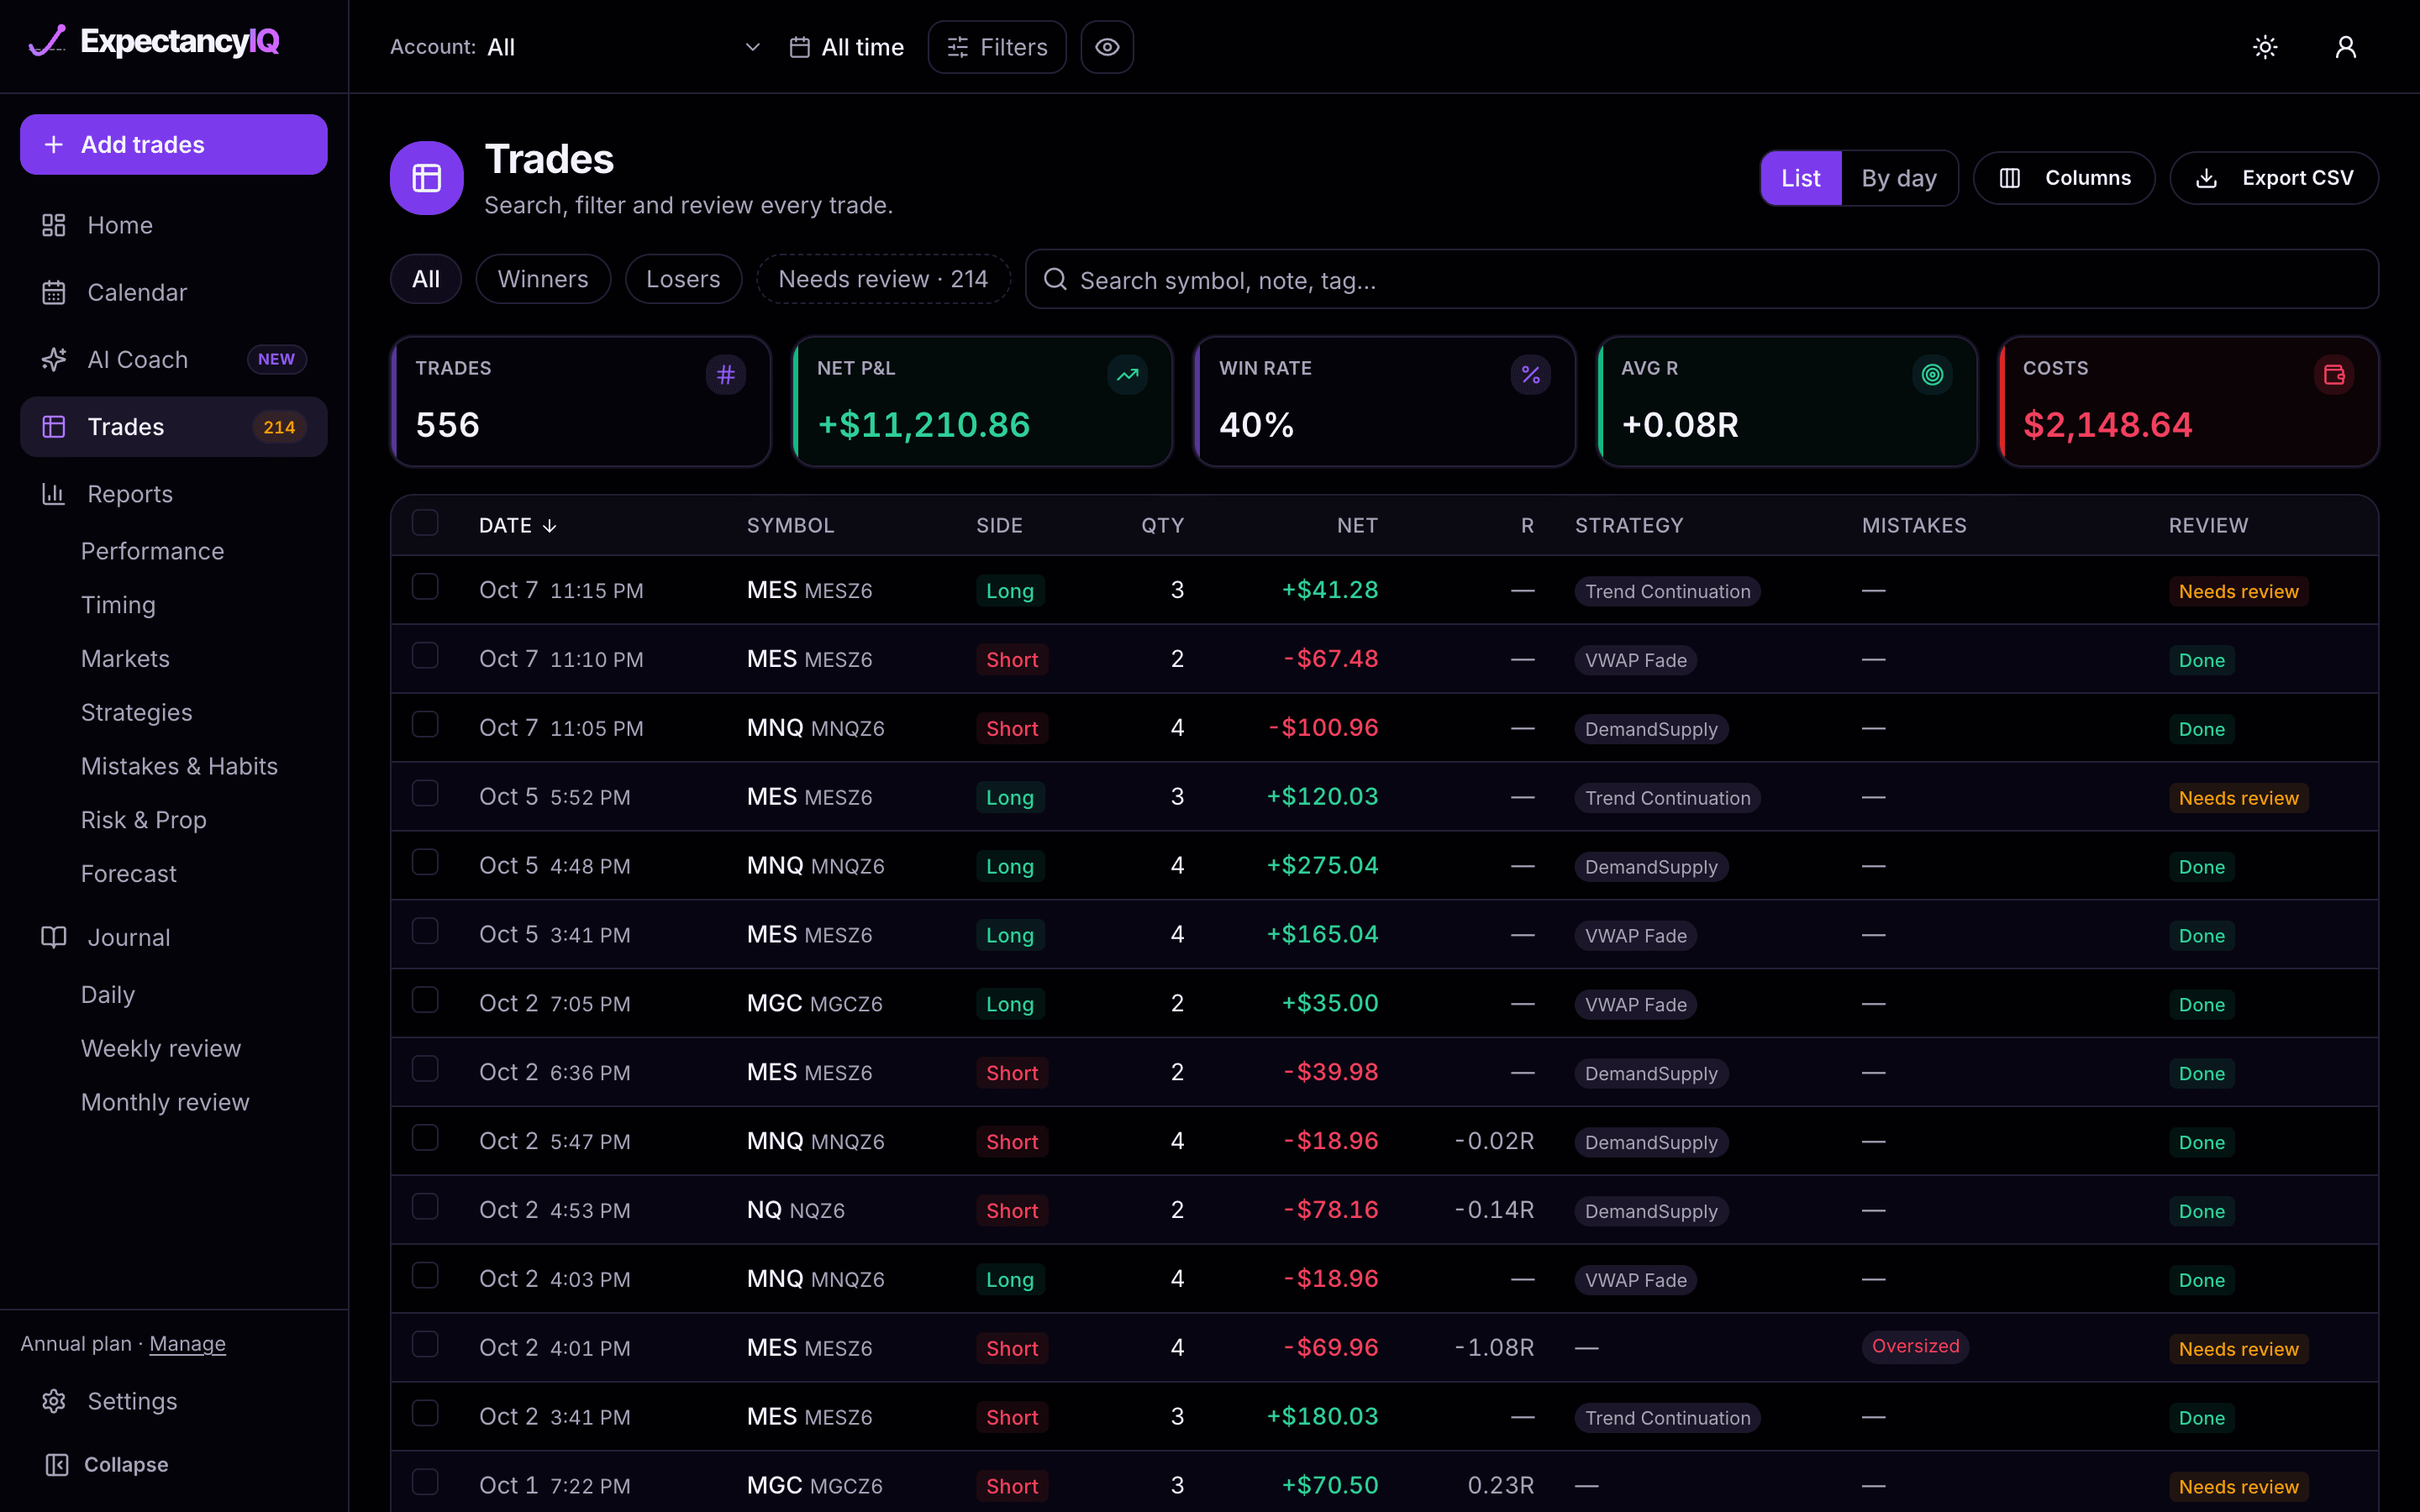
Edit many trades at onceTick rows to set a strategy, mark a mistake or tag them in one go.
Tick the boxes on the left of the rows you want (or Select all to take every trade matching your filters) and a bar appears: Add tag, Remove tag, Set strategy, Mark mistake or Delete. Delete asks you to confirm and can't be undone.
Needs reviewTrades without a strategy and one more detail, counted in the sidebar.
A trade counts as reviewed once it has a strategy and at least one more detail: a sub-strategy, confluence, mistake, plan figure, rules answer, grade, note or tag. The rest show as Needs review, counted next to Trades in the sidebar. Reviewed trades count towards the discipline part of your Trade Score.
Trade view
Did I follow my plan on this trade?
Open a tradeA side panel, or the full page; arrows step through trades.
Click a row and the trade opens in a panel beside the list. Use the arrows (or your keyboard's arrow keys) to step to the next or previous trade, Open full page for a larger view, and Escape to close.
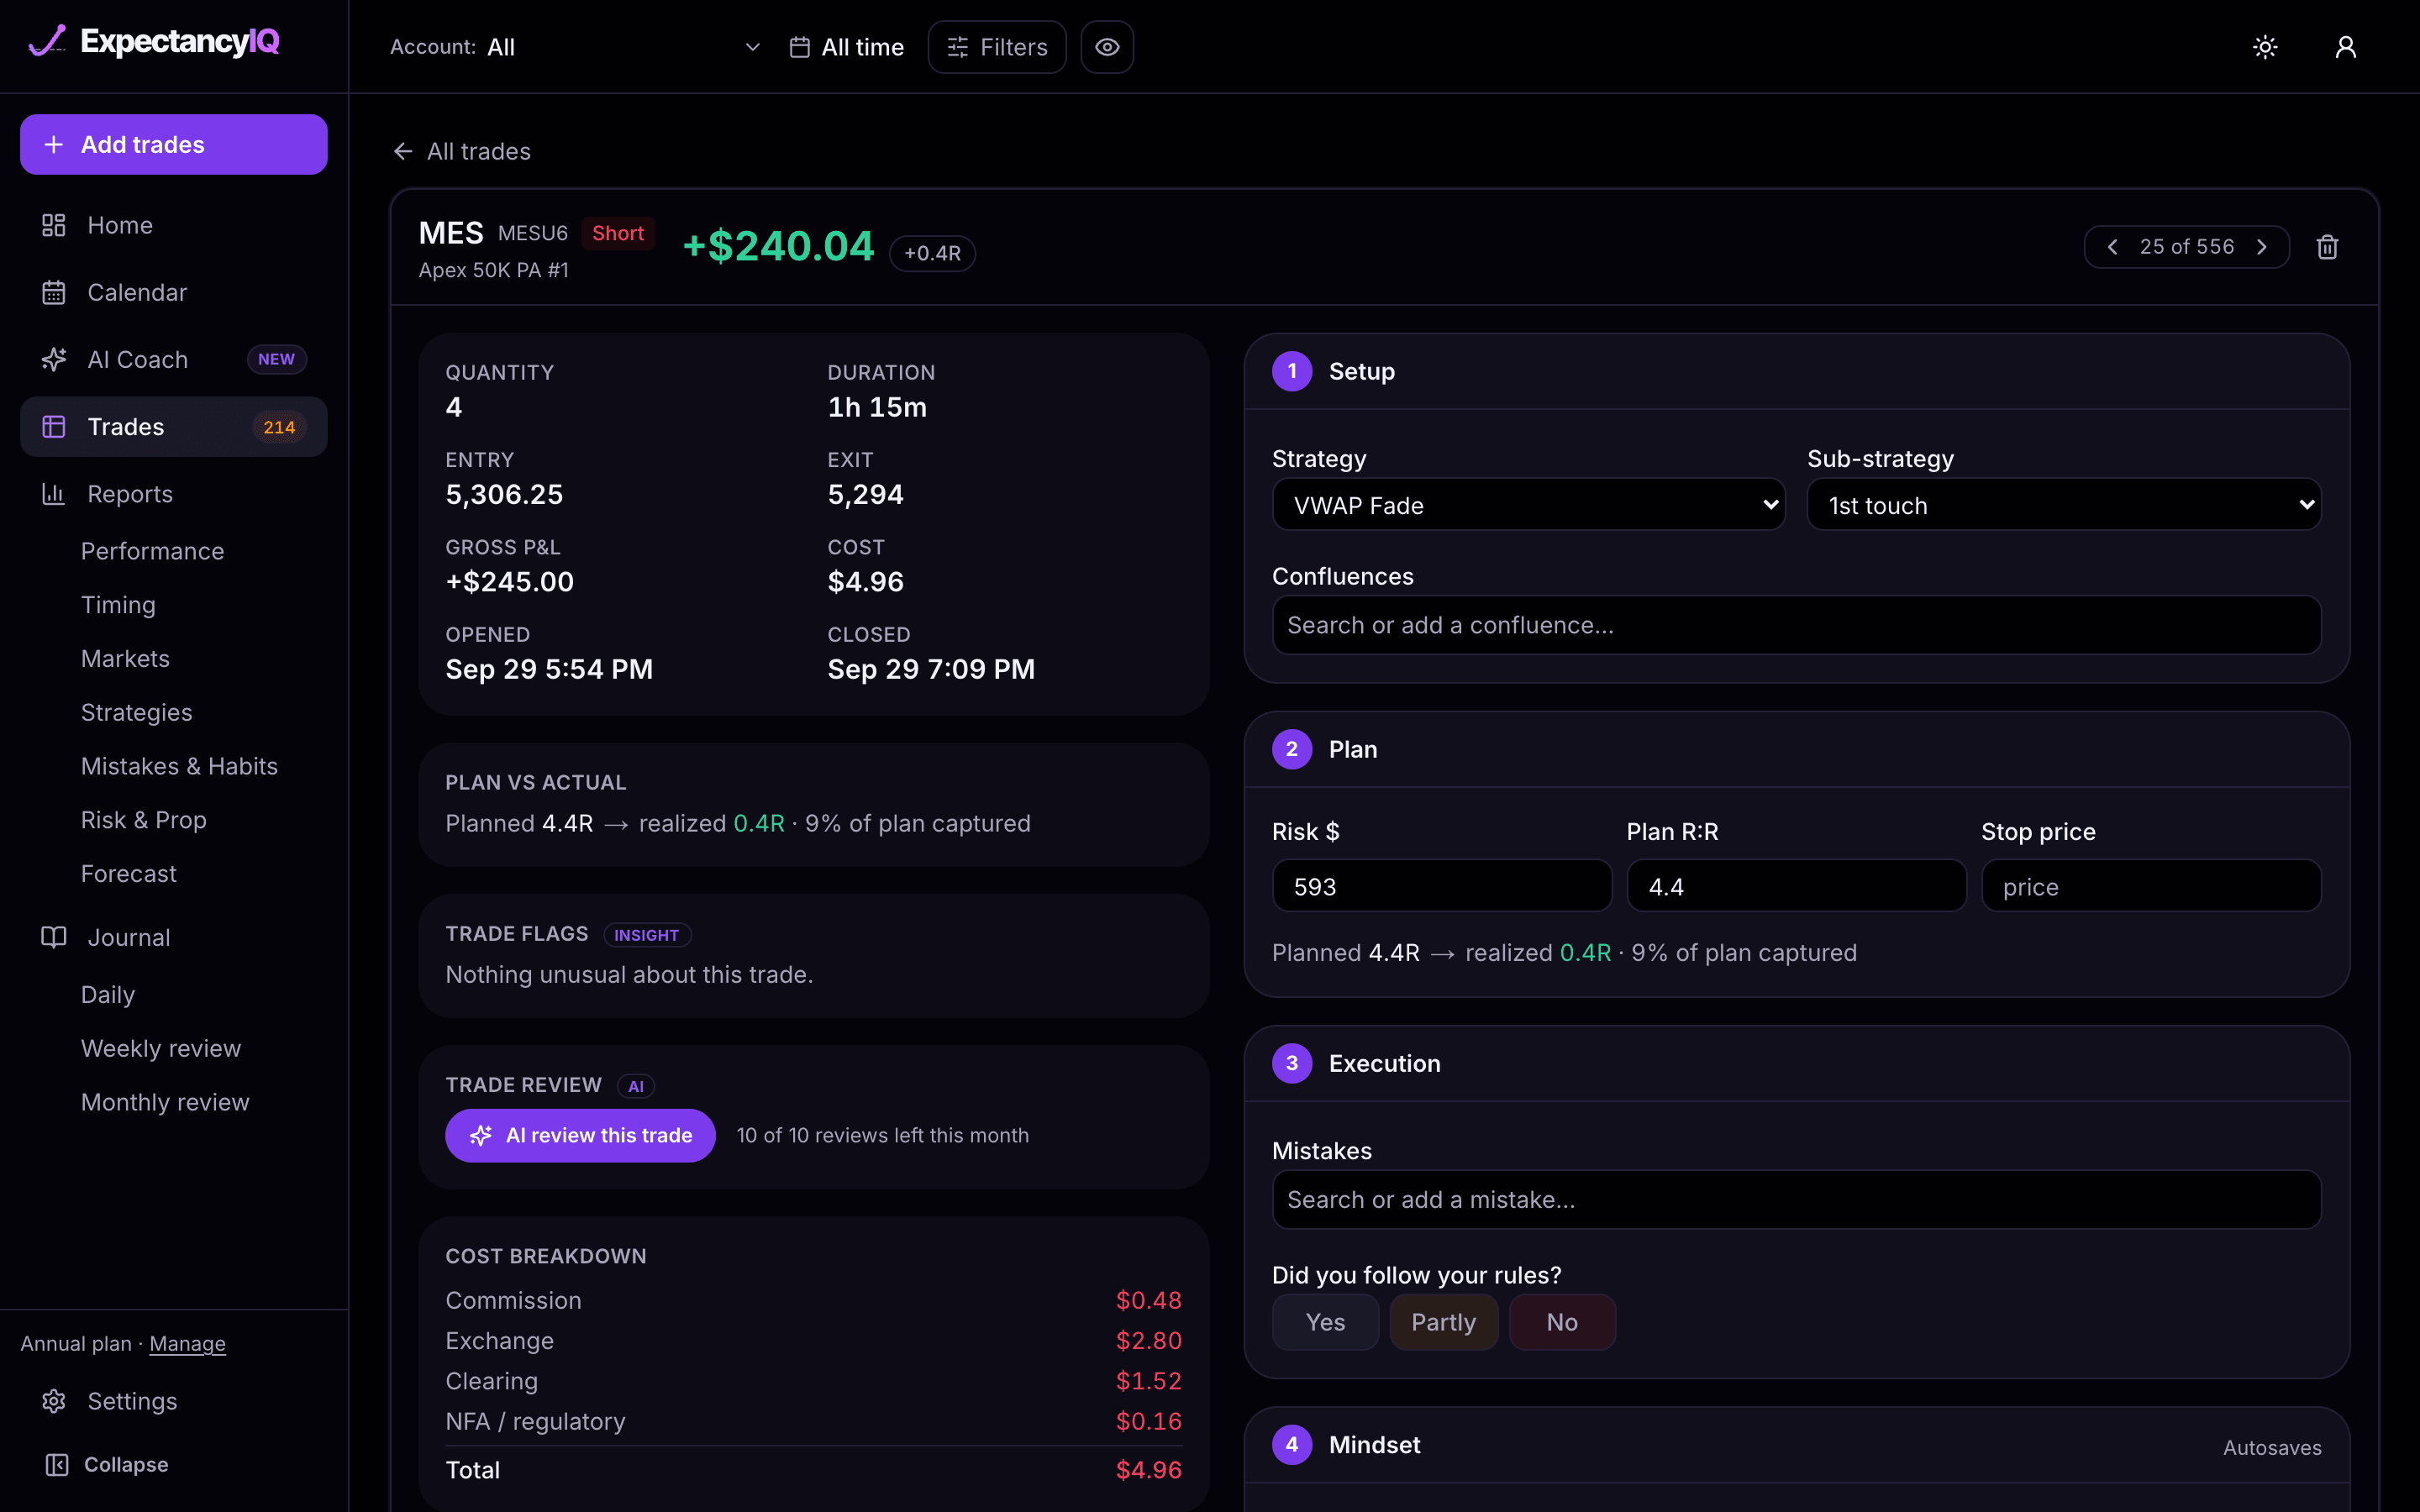
What the trade showsPrices, times, plan vs actual, trade flags and a cost breakdown.
- The facts: quantity, duration, entry and exit, gross P&L, costs, open and close time.
- Plan vs actual: once you enter a planned risk and R:R, how the result compares.
- Trade flags: anything unusual, such as an oversized position or a trade taken right after a loss.
- Cost breakdown: commission, exchange, clearing and regulatory fees, line by line.
- A link to that day's journal.
The five journal stepsSetup, Plan, Execution, Mindset, Notes & screenshots.
- Setup: strategy, sub-strategy and confluences.
- Plan: planned risk in money, planned R:R and stop price.
- Execution: mistakes, and whether you followed your rules (Yes, Partly, No).
- Mindset: how the trade felt, from Terrible to Great, and your emotions.
- Notes & screenshots: notes, tags, a one-lesson reflection (Markdown) and chart screenshots.
Fields save as you type. Give the trade a star grade at the bottom, then Save & next; tick Only trades needing review to jump straight to the next unreviewed one. Screenshots are private to you; the trial allows 20 a month and Pro has no limit.
Labels and tagsSet up strategies, confluences, mistakes and emotions once.
Strategy, sub-strategy, confluence, mistake and emotion lists live in Settings → Journal Setup. Add a label there once and pick it on any trade, or type a new one straight into a trade and it is saved to your list. Tags are free text with no setup, for one-off labels. Use labels for anything you want the Reports to break down.
AI trade review (Pro)A written critique and one thing to do next time. 10 a month.
Click AI review this trade and the coach judges whether you followed your plan, separately from whether the trade made money, then gives one thing to do next time. It works from the trade's figures and your journal steps; when something isn't logged it says so. Pro includes 10 reviews a month.
Reports
Is my edge real, and where does it come from?
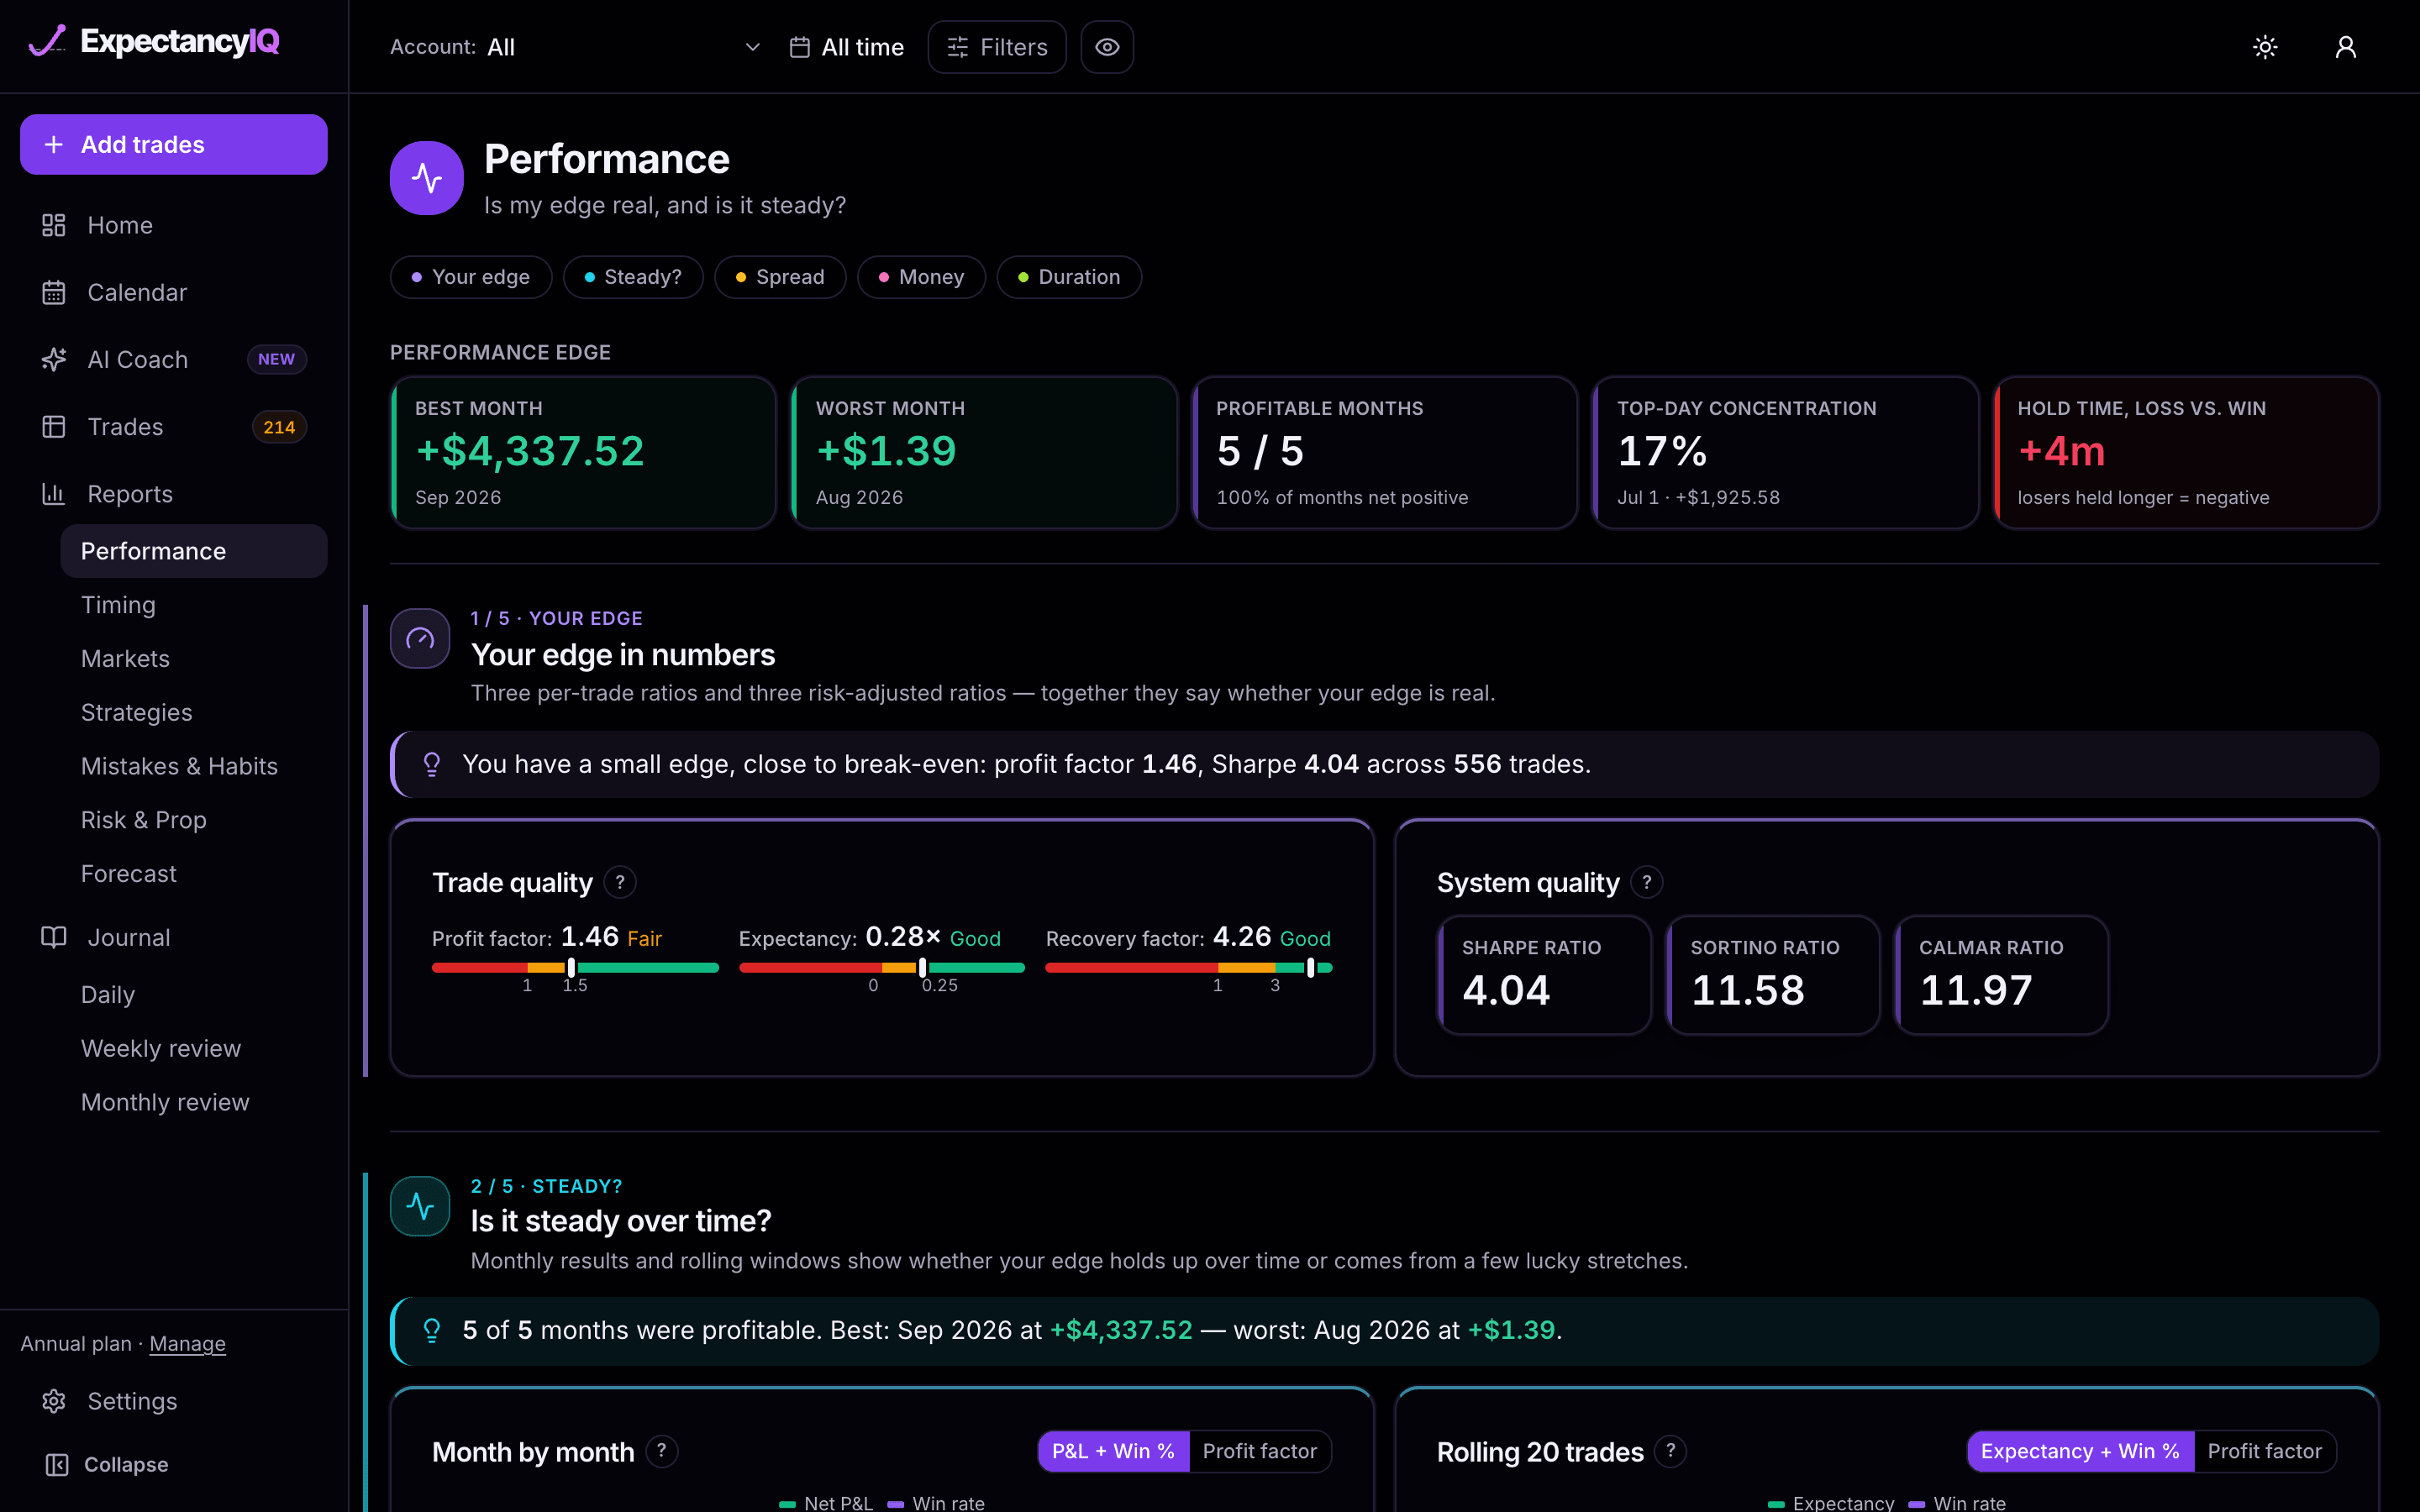
PerformanceIs my edge real, and is it steady?
Your edge in numbers (profit factor, expectancy, recovery factor, Sharpe, Sortino and Calmar), whether it holds month by month and over a rolling 20 trades, how your results are spread, where money comes from and goes, and how long you hold winners against losers.
TimingWhen do I trade best, and am I trading too much?
P&L by session, day and hour (with a day × hour heatmap), your first trade of the day against the rest, average P&L by trade number of the day, and how quickly you re-enter after a trade.
StrategiesWhich setups work, and are they still working?
Net P&L, win rate and average P&L per trade for each strategy and sub-strategy, monthly and cumulative P&L by strategy, and a strategy × symbol win-rate map. Strategies come from the Setup step of each trade.
MarketsWhat should I trade?
Where you make and lose money by symbol and asset class, your top performers, how often you win on each, and how big your trades are, with a symbol map of P&L against trade count.
Mistakes & HabitsWhat is costing me money?
The money cost of each mistake, how often each one happens, clean trades against trades with a mistake, what confluences help, trades after a win against after a loss (tilt), your position size spread, and whether your mistakes are falling over time.
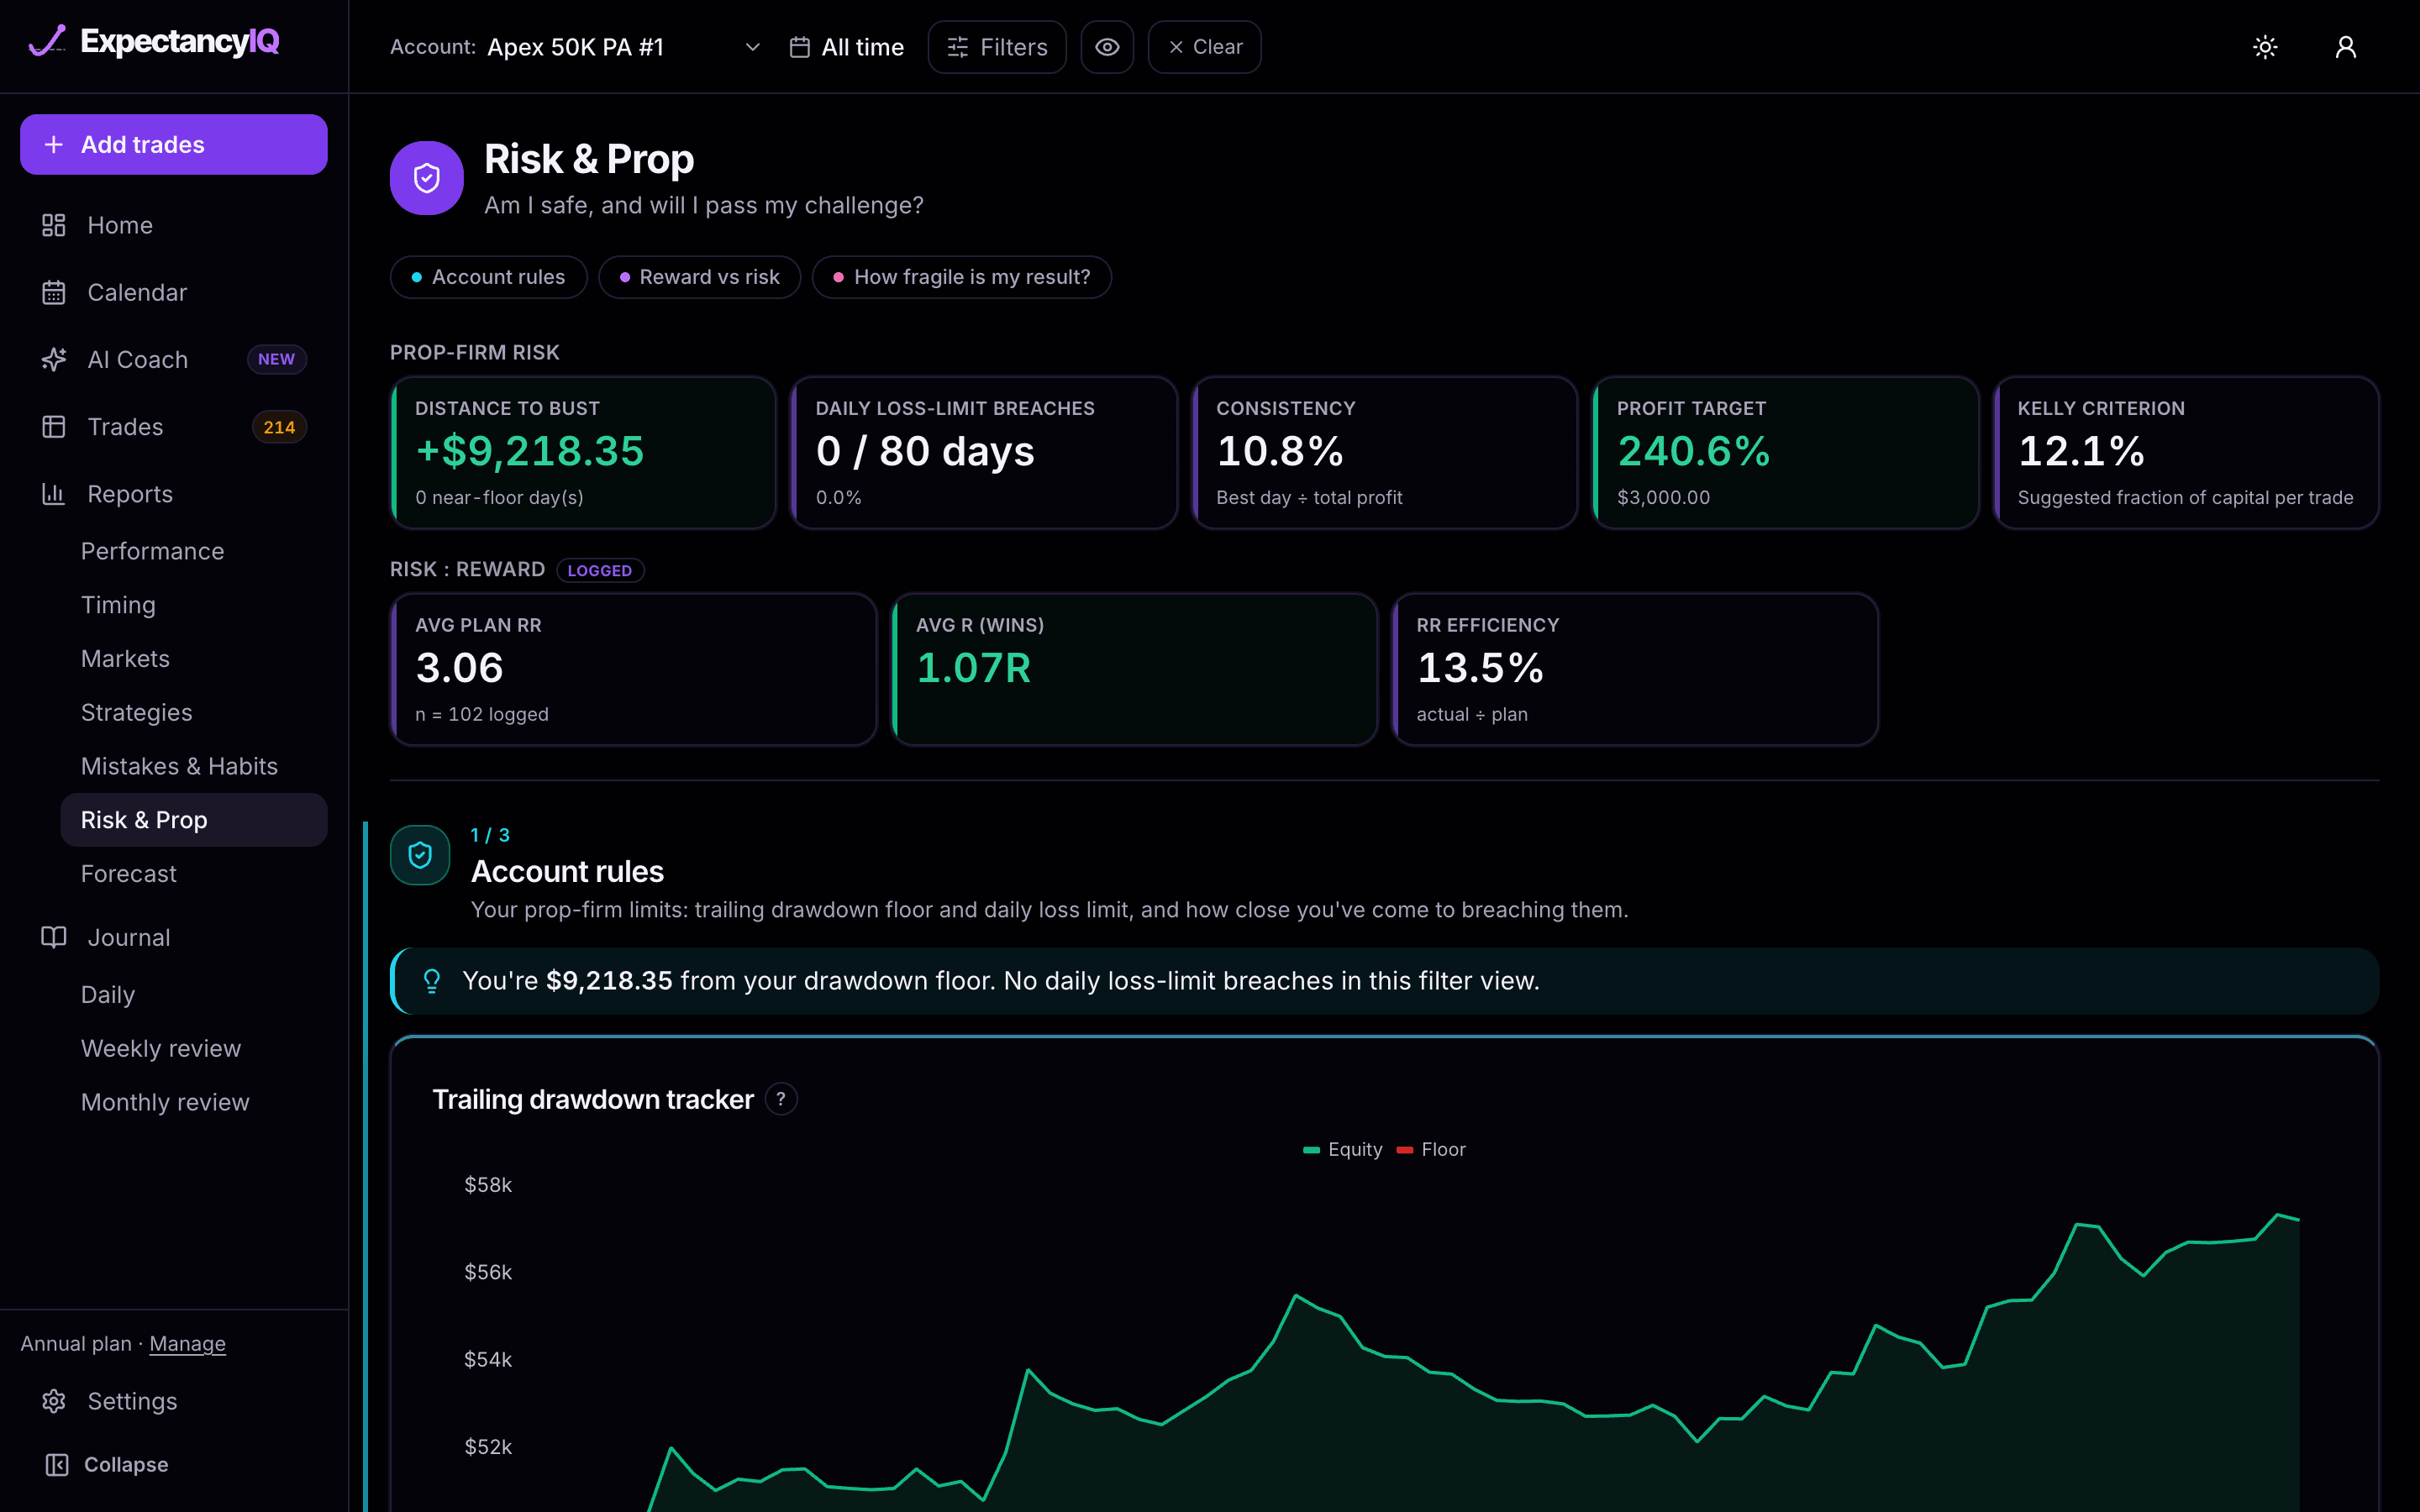
Risk & PropAm I safe, and will I pass my challenge?
Select one account to check it against its own rules: distance to bust, daily loss-limit breaches, consistency, progress to the profit target and a trailing drawdown tracker, plus risk to reward and your R-multiple spread. Set the rules once per account in Settings → Trading Accounts → Risk & Limits: static, trailing end-of-day or trailing intraday drawdown, daily and max loss limits, profit target and consistency %.
Forecast (Pro)What happens if I keep trading like this?
Forecast replays your own trade results 1,000 times to show the chance of reaching your profit target before you hit your drawdown limit, with a fan of likely equity paths. It needs one account selected, and the same data always gives the same answer. The methodology page explains how it works.
Locked charts on the trial43 of 53 charts are open; the deep dives are Pro.
On the trial a few deep-dive charts show blurred with an upgrade note: the day × hour heatmaps, strategy × symbol, cumulative P&L by strategy, gross vs cost by month, hold time vs P&L, rolling 20 trades and mistakes over time, plus Forecast. Everything else in Reports is open.
AI Coach
What do my trades say I should change?
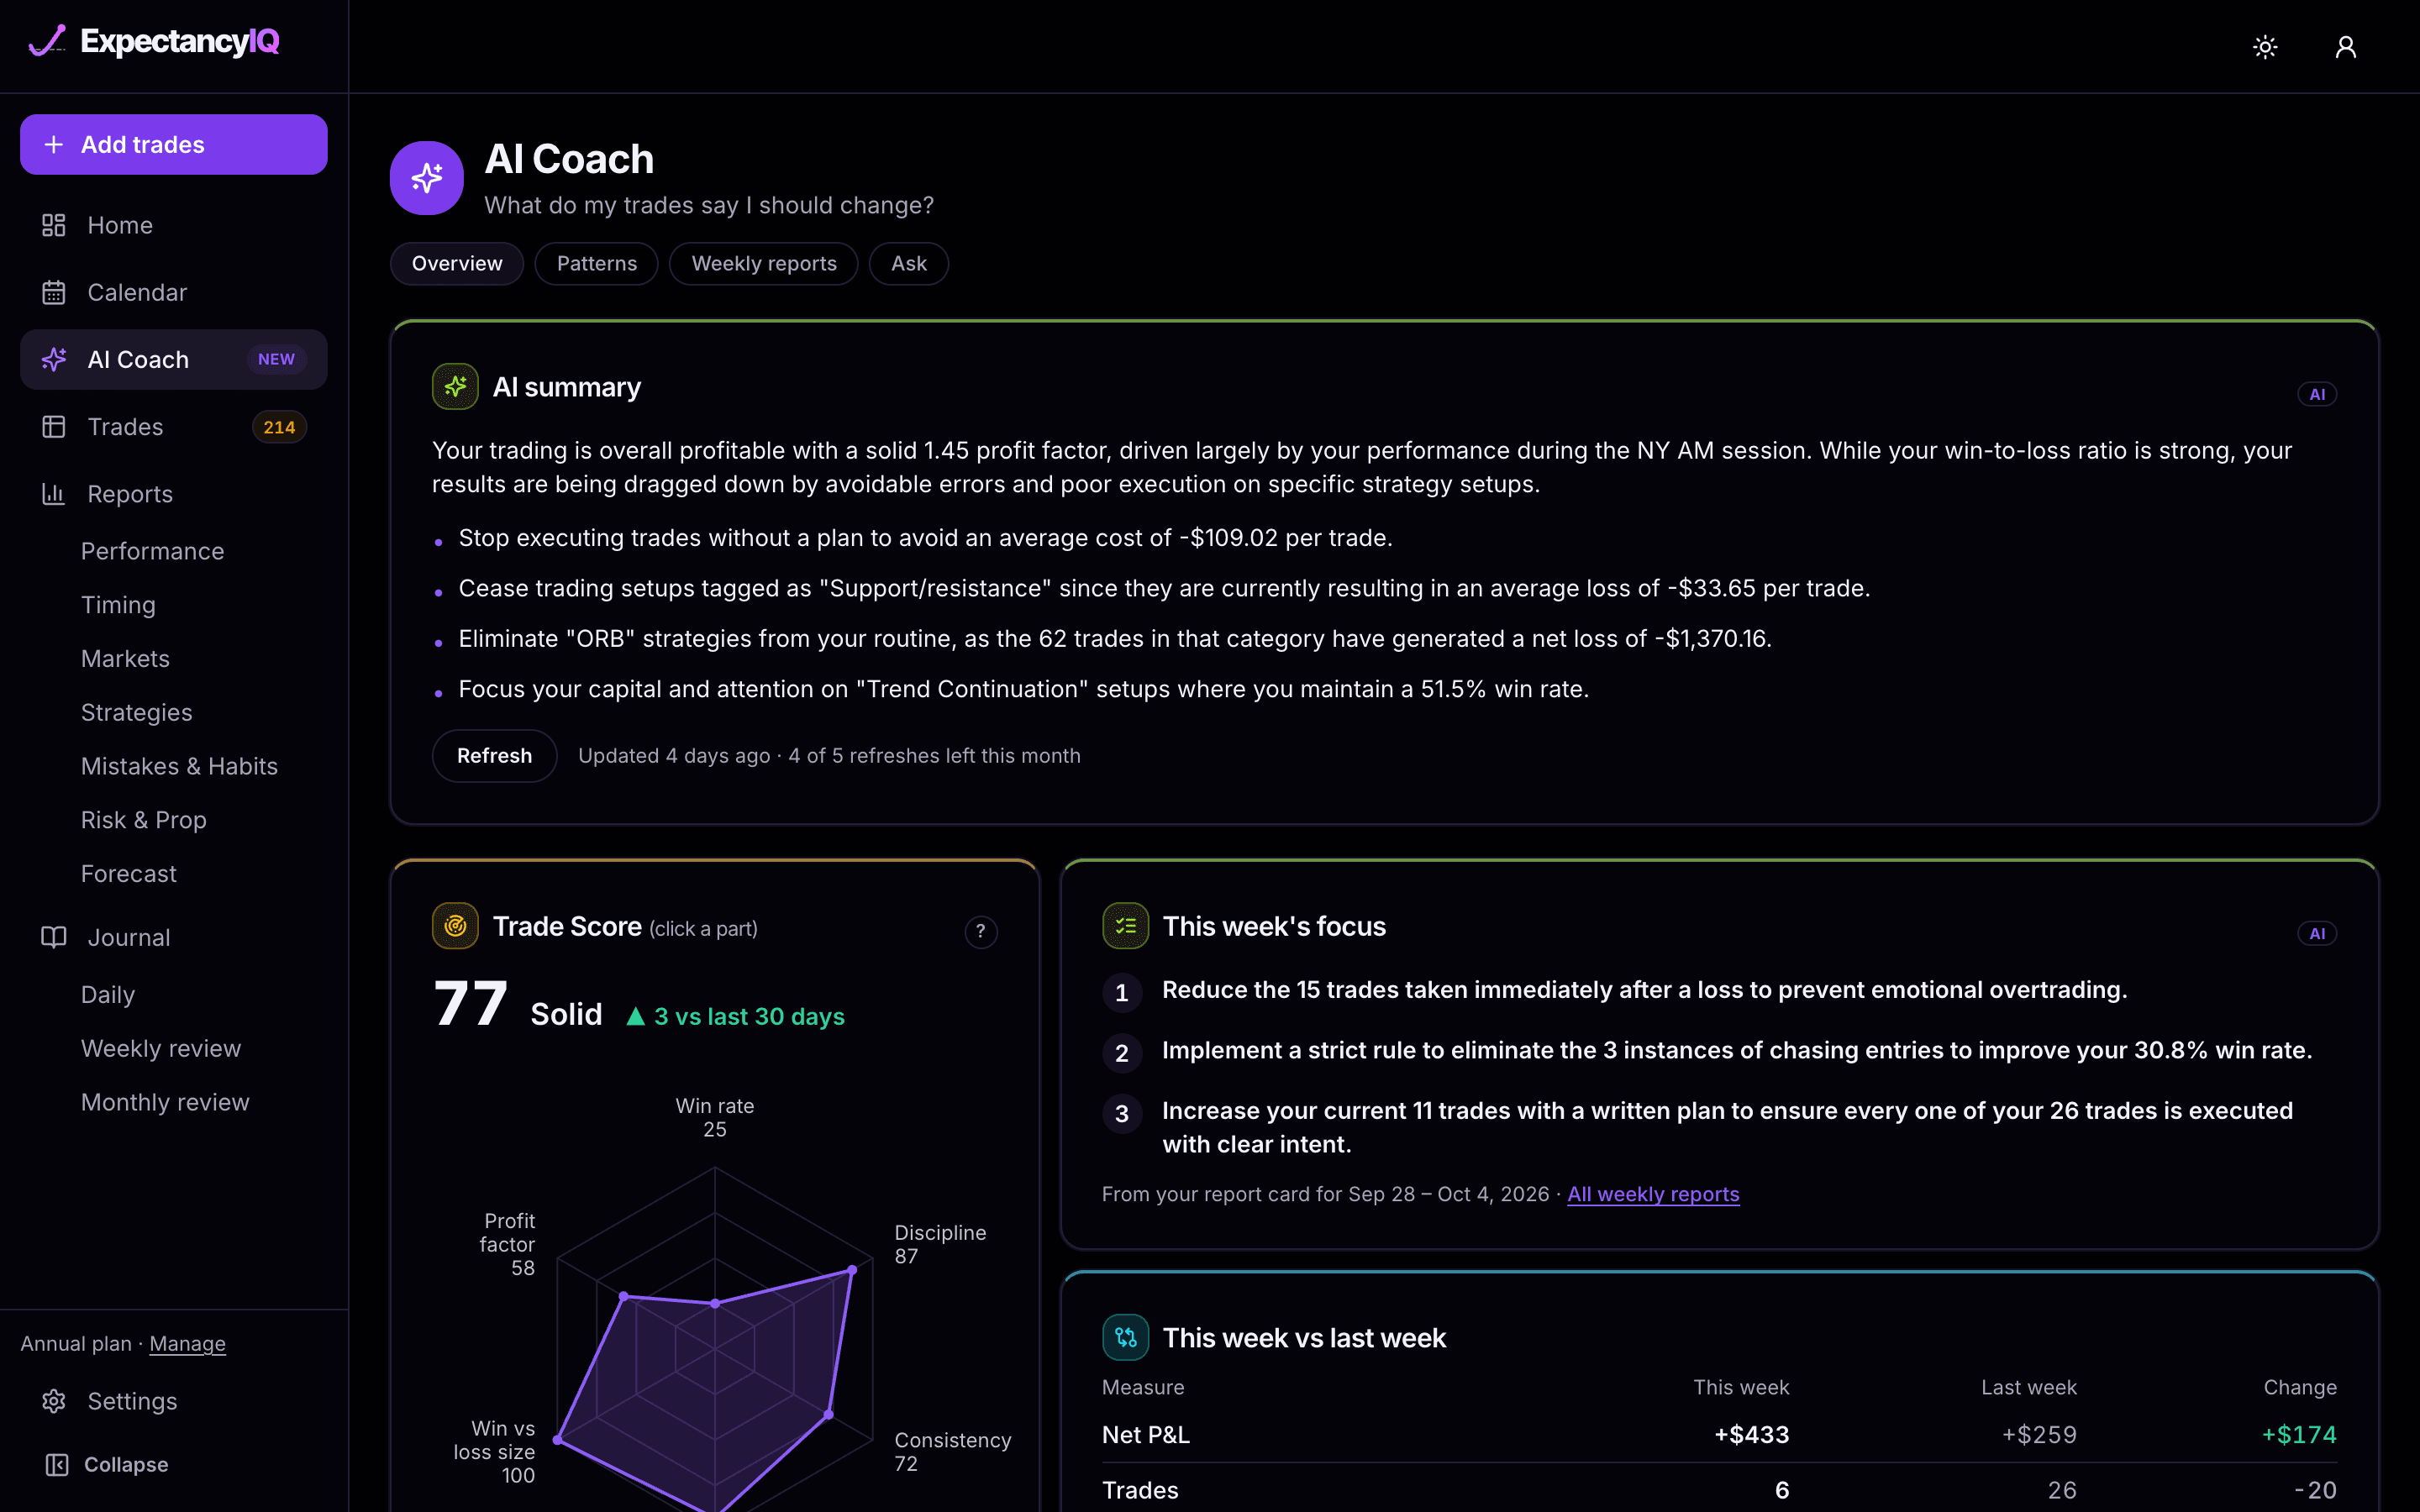
Overview and AI summaryYour patterns in a few sentences, with 2–4 actions.
The AI summary (Pro) reads your whole history and writes what it says about your trading, with two to four actions tied to your figures. It writes itself once you have 50 trades; Refresh rewrites it after you add more (5 refreshes a month). Beside it: your Trade Score, this week's focus from your latest report card, and this week against last.
PatternsStrengths and leaks found in your trades, with their money impact.
Insight cards for your strongest sessions and strategies and your costliest mistakes and habits, each with the figures behind it and an estimated money impact. These are worked out by the app, not the AI. The trial shows the first 2 in full.
Weekly report card (Pro)A grade from A to F and three actions, every week.
When a week ends, the coach grades it from A to F on process and results together, writes one line on what defined it, and gives three actions for next week. Past report cards are kept under Weekly reports.
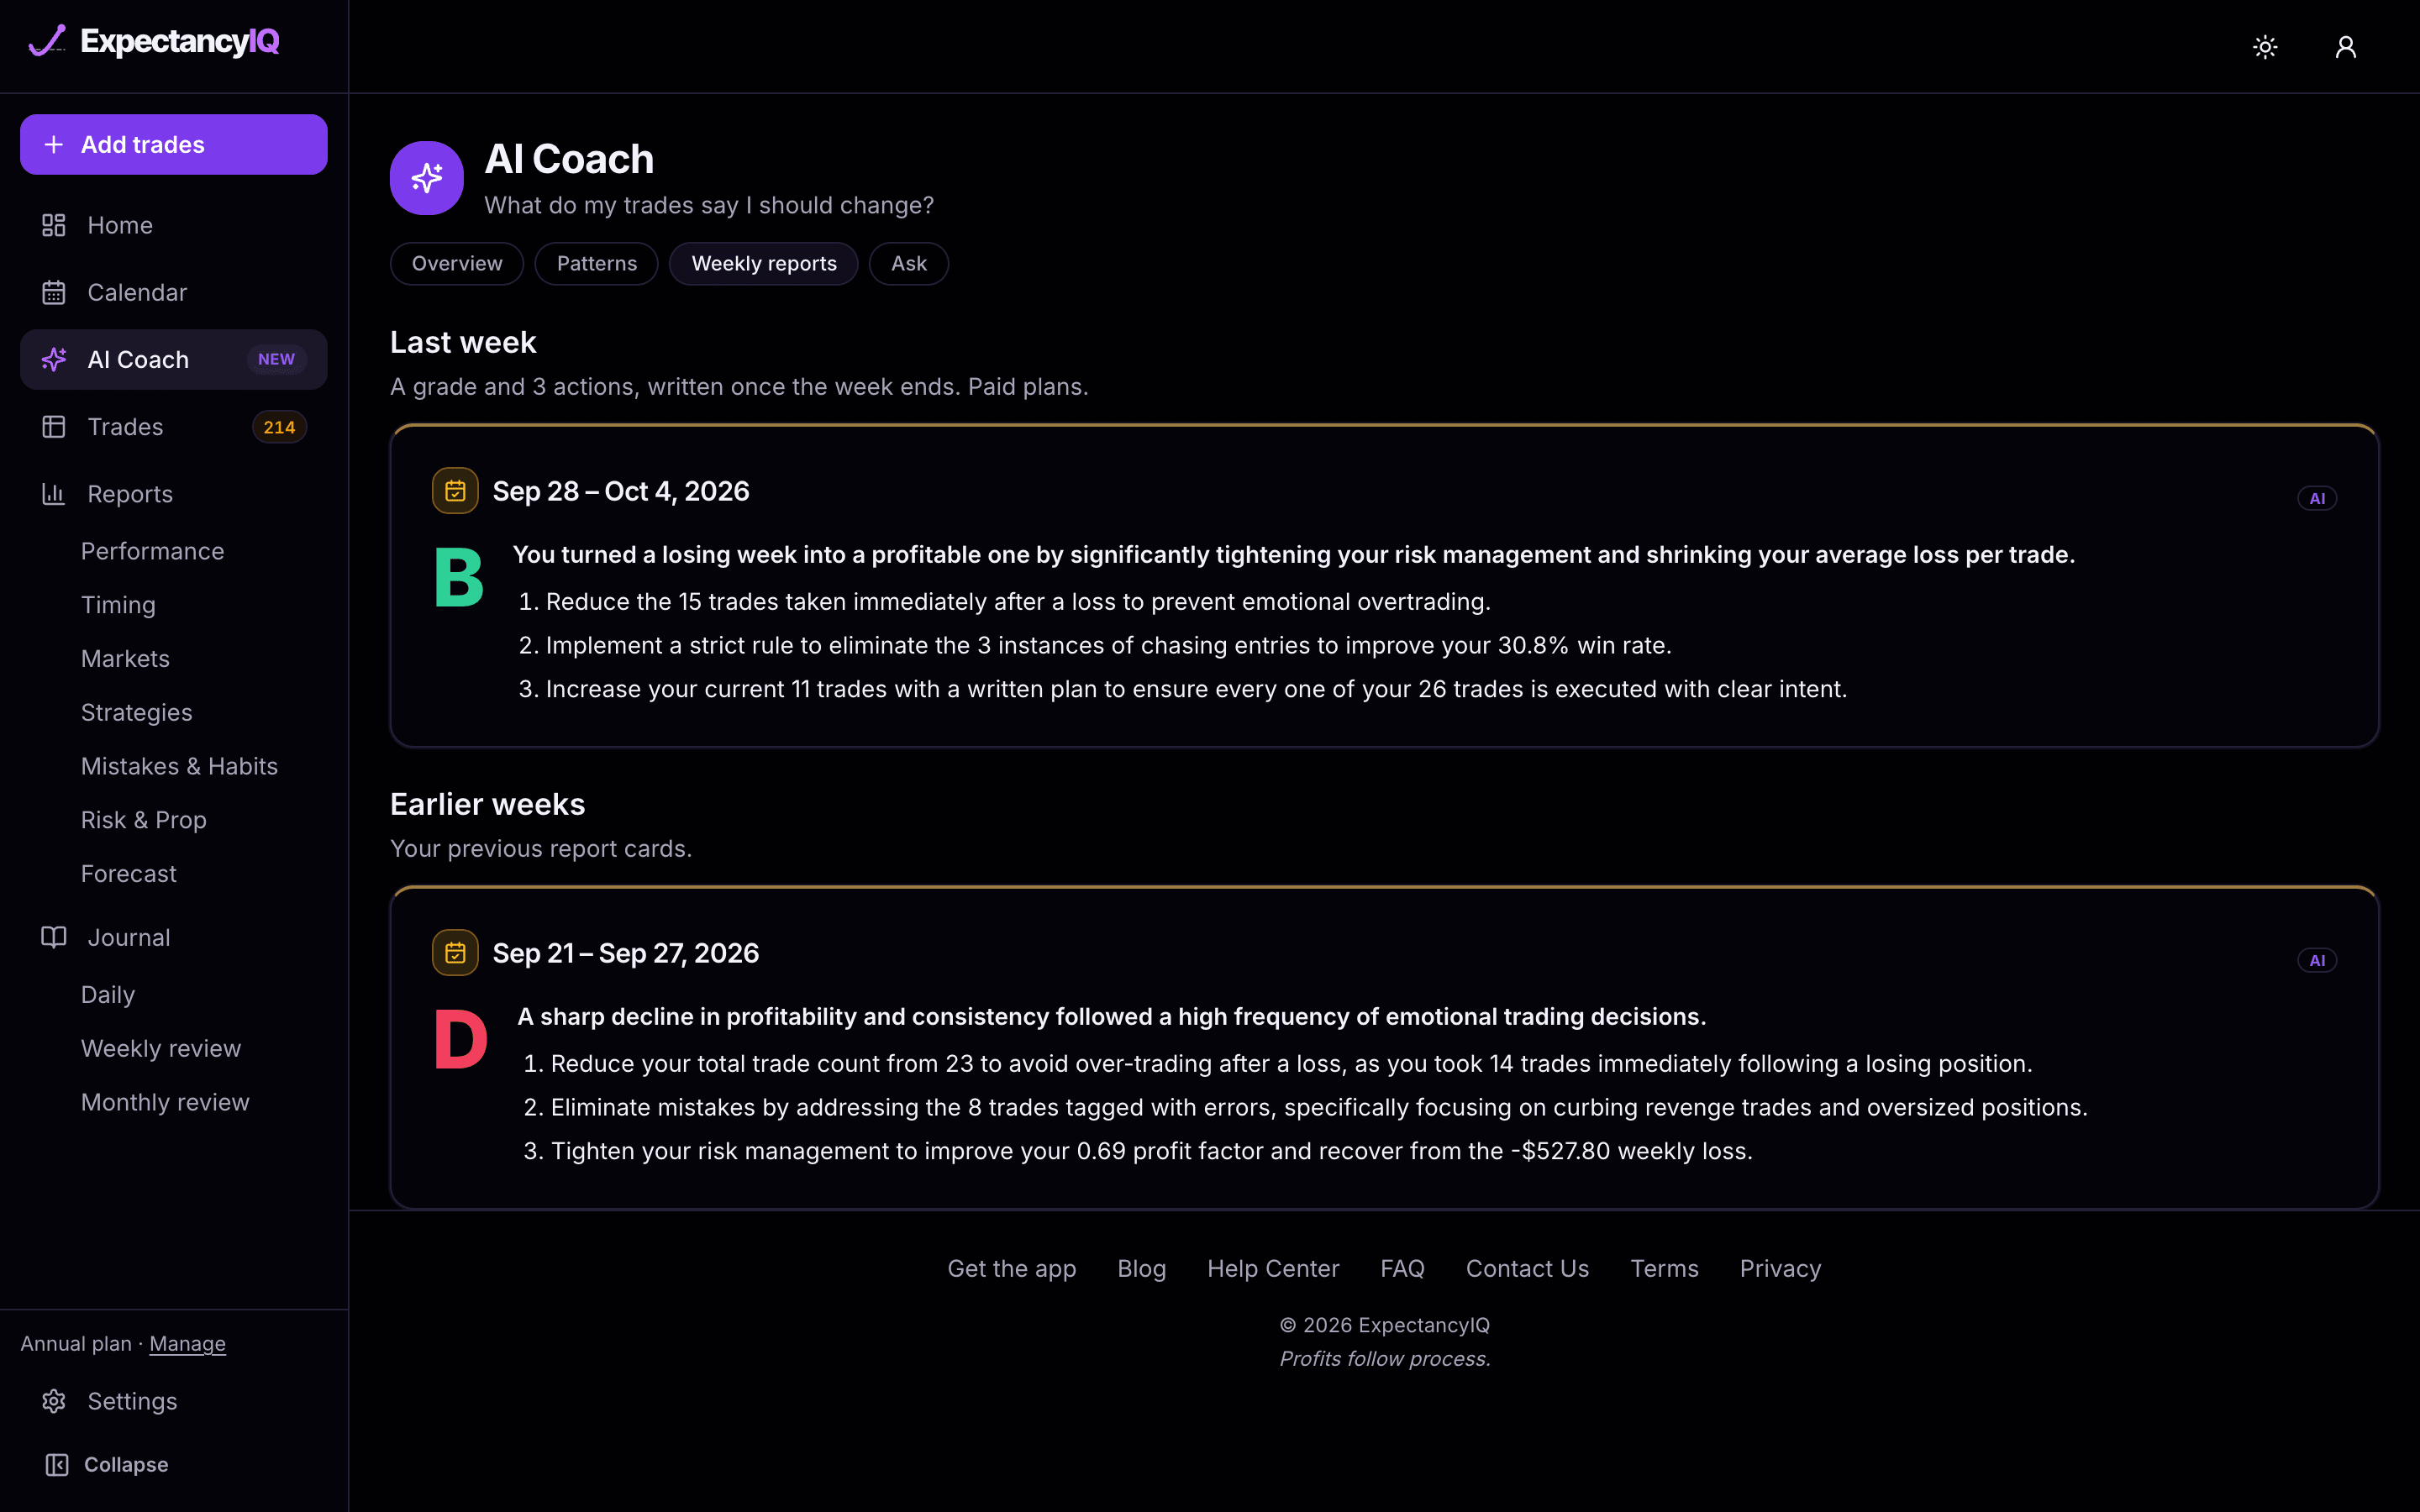
Ask (Pro)Questions about your own results. 10 a month.
Ask questions such as “Why did I lose last week?” and follow up in the same thread (“and in the morning?”). The coach answers only about your own trades; it won't give trade signals or market calls. Pro includes 10 questions a month.
What the coach seesOnly figures the app already worked out from your trades.
The coach reads the totals and rates the app has already calculated, not your raw trade list, and is told to use only numbers that are there. When a figure is missing it tells you what to log instead of guessing. Each AI feature has a monthly allowance, shown next to its button; they reset on the 1st.
Journal
How did the day, week and month go?
Daily journalPre-market plan, checklist, mood, notes and the day's trades.
One page per trading day: a pre-market plan and checklist, how you felt (1–5) and your emotions, notes, and a post-market review. On the right, the day's trades and stats, with flags for tilt, overtrading and loss-limit breaches. Everything saves as you type. Move between days with the arrows, the date picker or your keyboard's arrow keys.
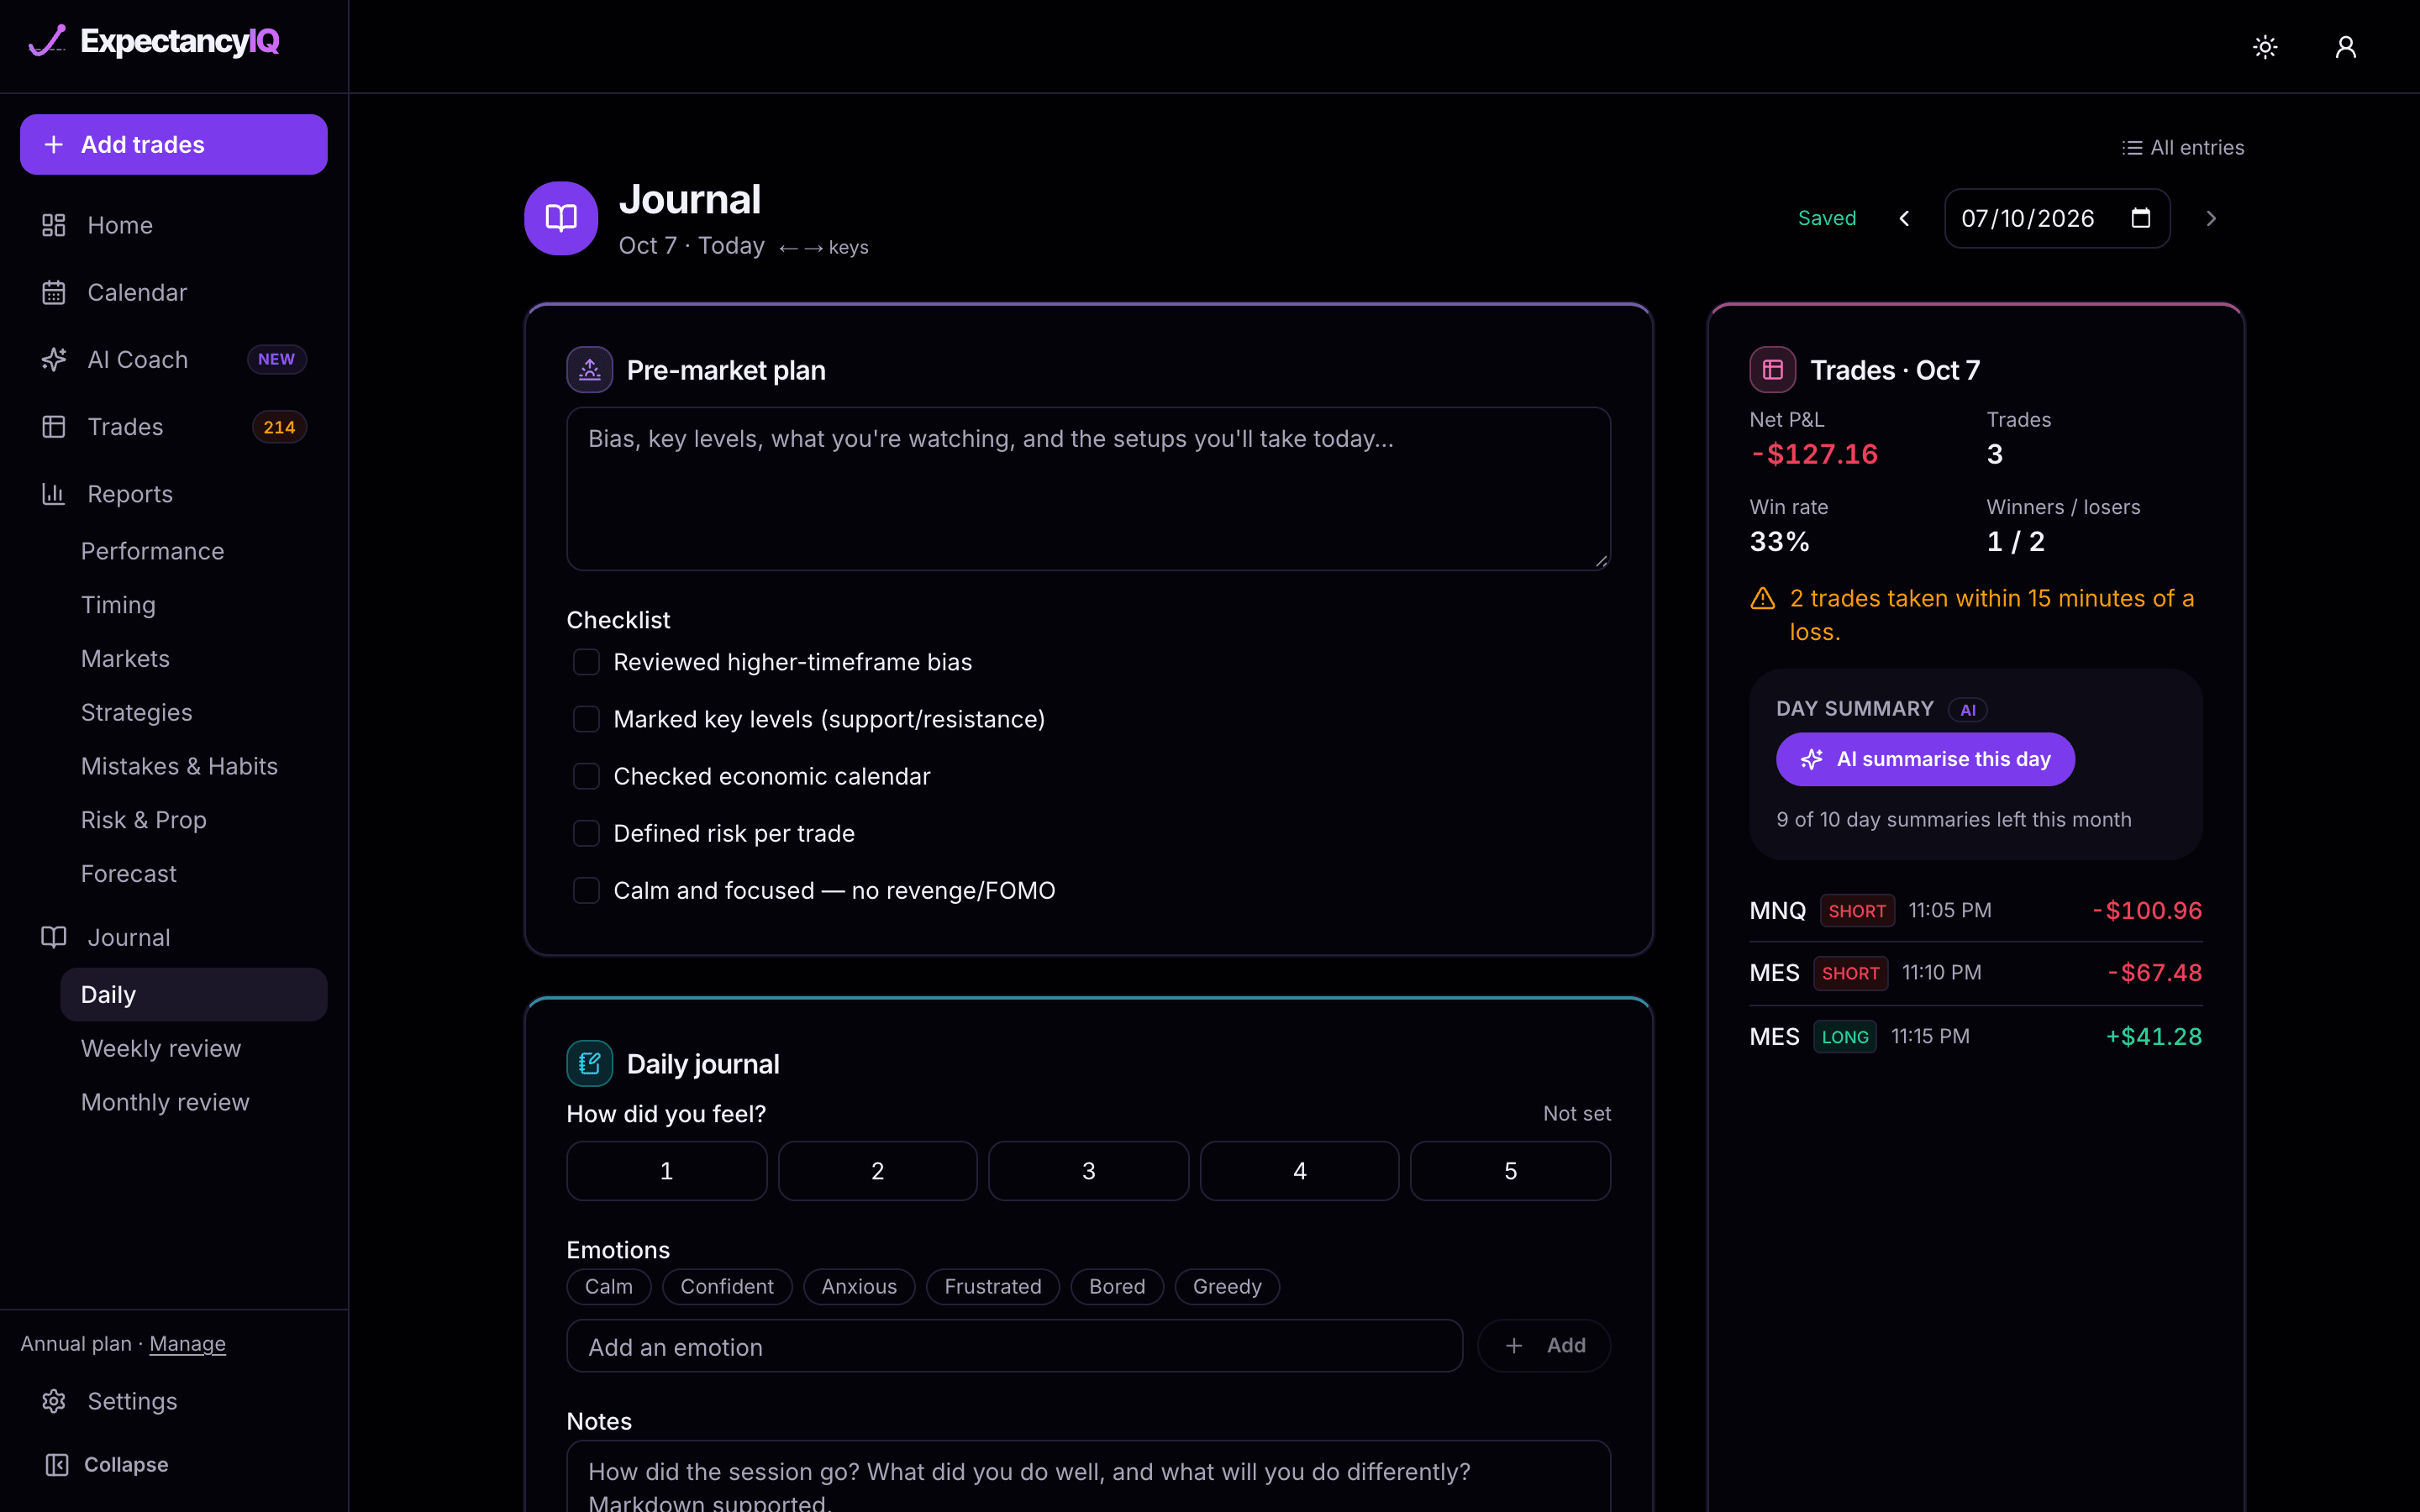
AI day summary (Pro)Three lines on how the day went. 10 a month.
Click AI summarise this day for a three-line summary of the session, including any tilt, overtrading or loss-limit issues. Pro includes 10 day summaries a month.
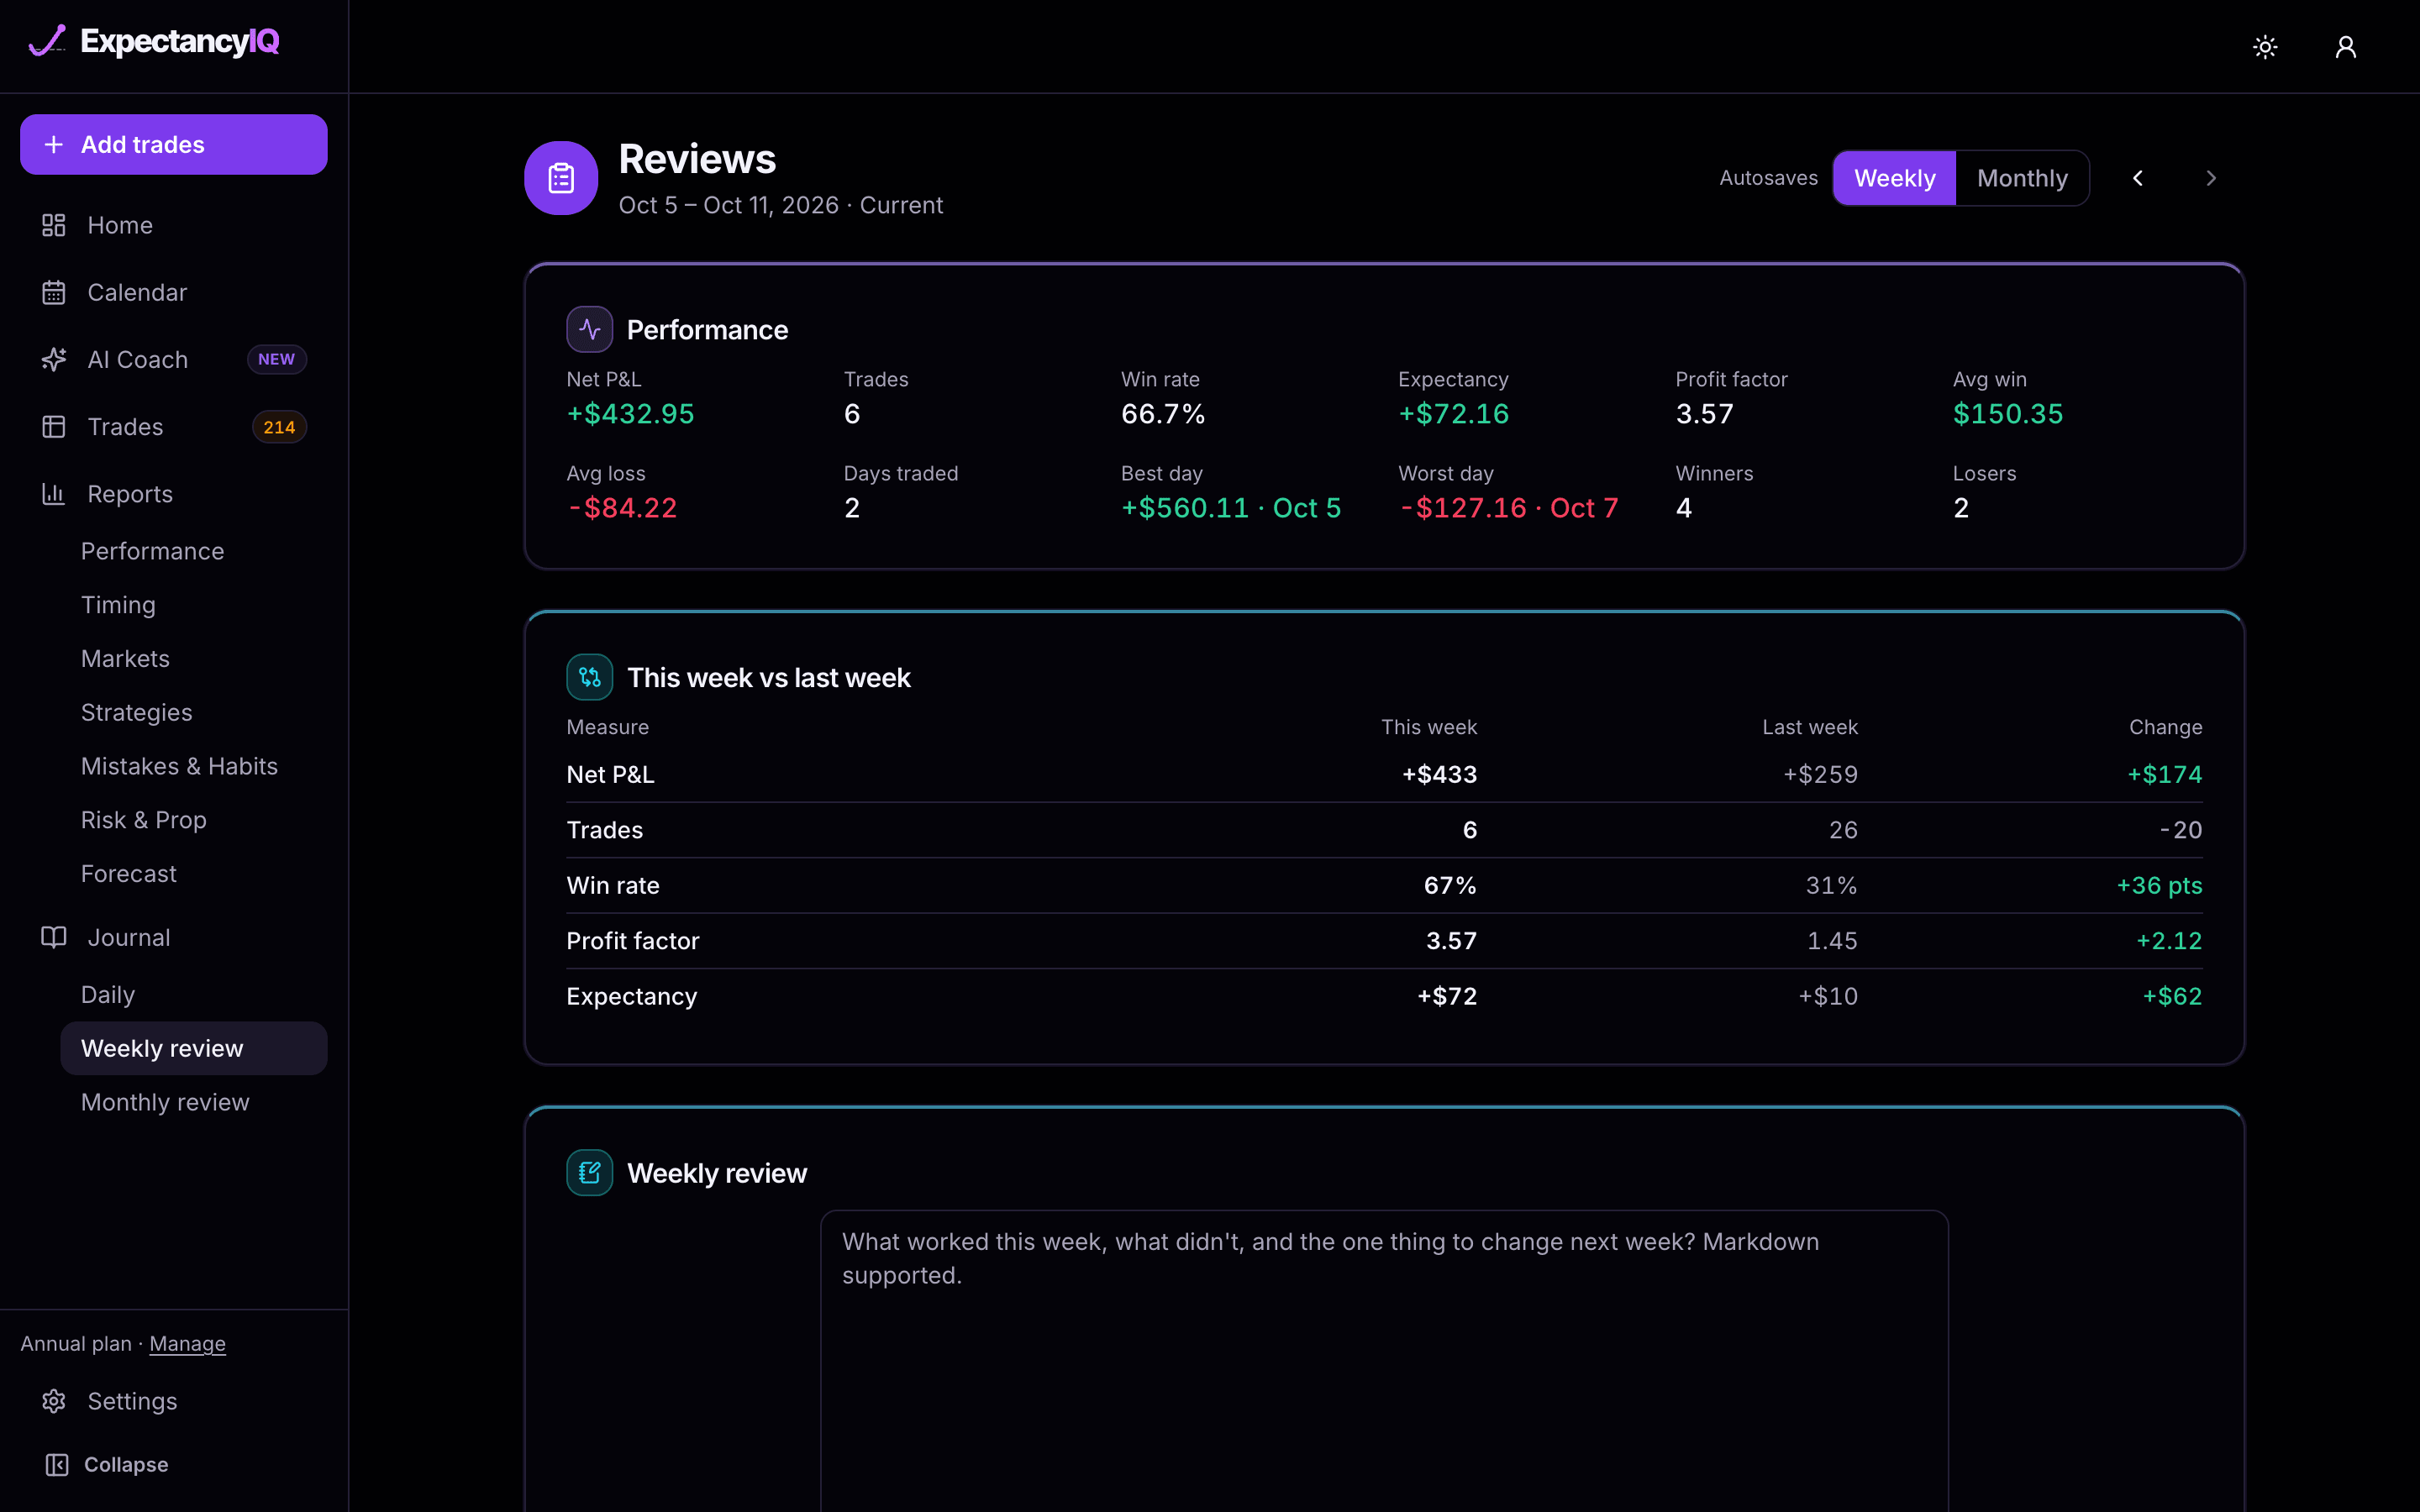
Weekly and monthly reviewsThe period's stats, this vs last, and your written review.
Each week or month gets its performance figures (net P&L, win rate, expectancy, profit factor, best and worst day), a comparison with the period before, and space for your own written review in Markdown. Switch between Weekly and Monthly at the top and step back through past periods.
All entriesSearch every daily, weekly and monthly entry you've written.
All entries, at the top right of the Journal, lists every daily journal, weekly review and monthly review you have written, with a search box to find a word or setup across all of them.
Settings
How do I set up my accounts?
Trading accountsName, type, currency, prop-firm rules and deposits.
- Account Details: name, type (live, funded, evaluation or simulated) and currency. Changing the currency relabels amounts; it doesn't convert them.
- Risk & Limits: drawdown rule, daily and max loss limits, profit target, consistency % and your fixed risk per trade for R-multiples. These drive Risk & Prop and Forecast.
- Deposits & Withdrawals: your starting balance and any cash in or out, so the balance matches your statement. They never change win rate, expectancy or drawdown %.
- cTrader Sync (Pro) and Danger Zone, which deletes one account and its trades.
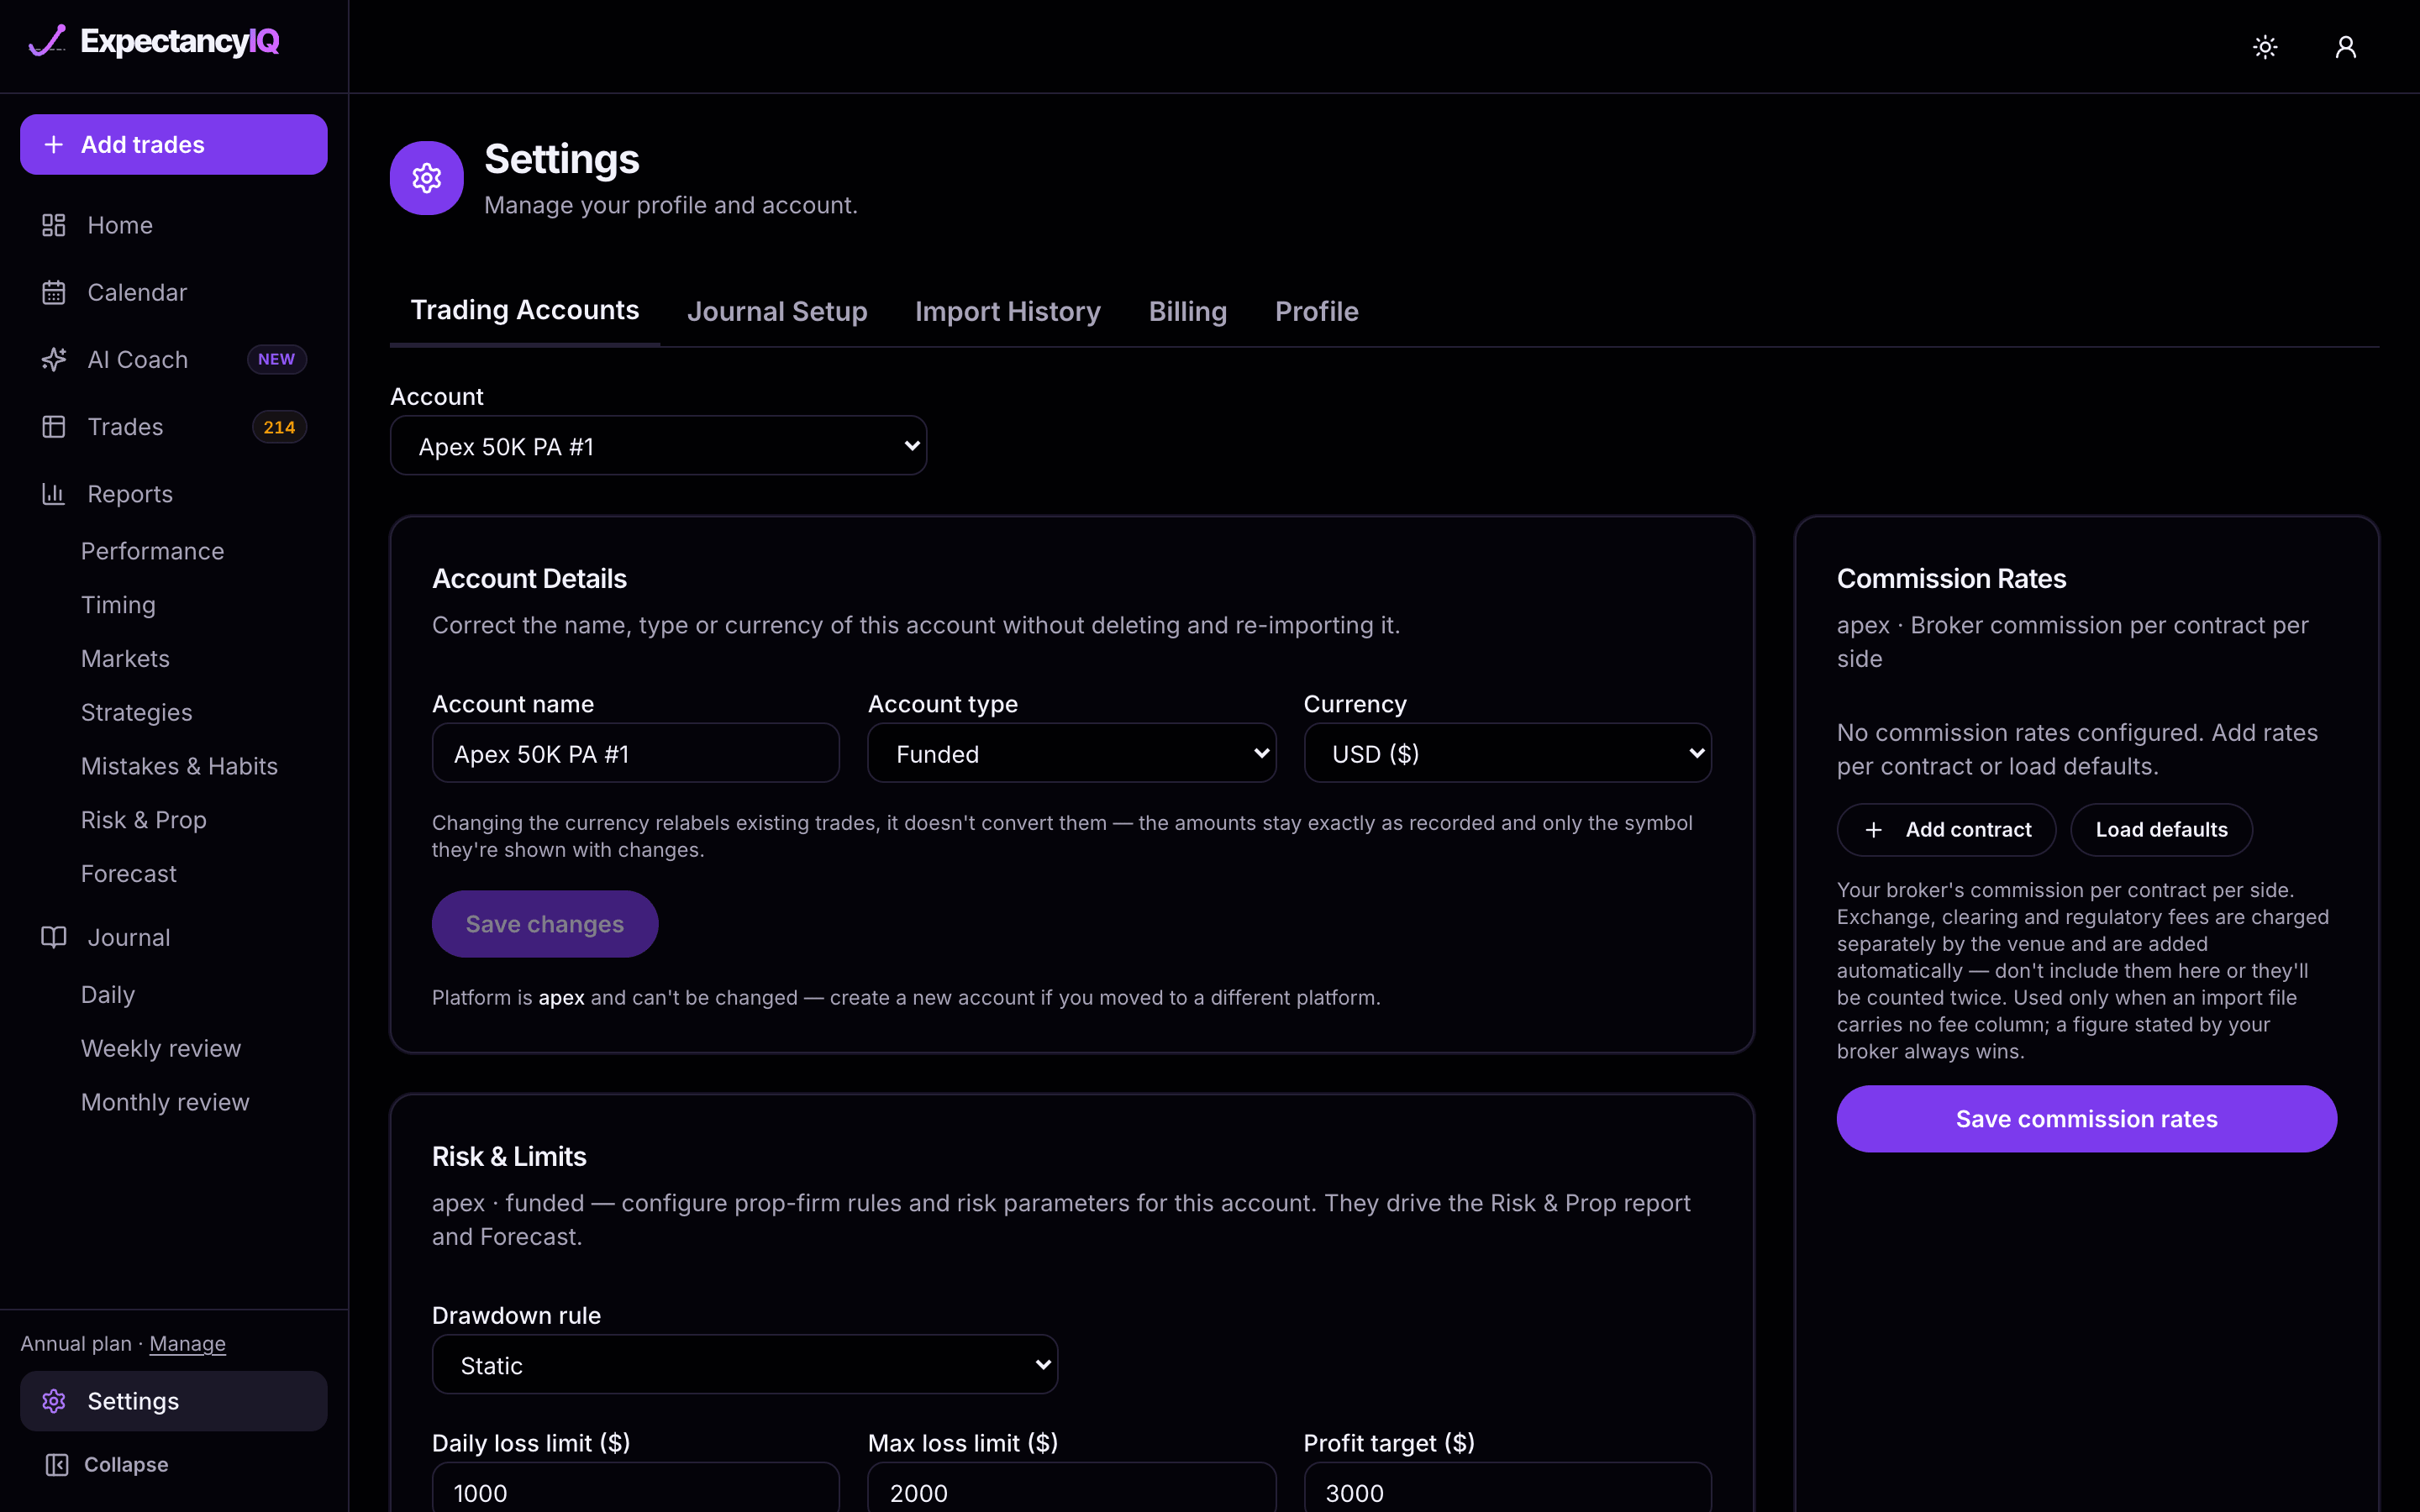
Commission and exchange feesUsed only when your file carries no fee column.
Commission Rates holds your broker's commission per contract per side; Load defaults fills in common rates. Exchange & Regulatory Fees are charged by the venue and already known for the common micro contracts; add a contract only if it's missing, or load your broker's fills and cash history exports to read the exact rates. A fee stated in your import file always wins.
Journal SetupYour strategy, confluence, mistake and emotion lists.
Add, rename or remove the labels you pick on each trade: strategies, sub-strategies, confluences, mistakes and emotions. Deleting a label that trades already use asks you first; those trades keep it, it just stops being offered.
Profile, billing and your dataName, timezone, plan, export and account deletion.
Profile sets your display name and trading timezone, and holds Your Data (export everything as a file) and the option to delete your account. Billing shows your plan and opens the billing portal to upgrade, change or cancel.
Can't find it? Contact us and we'll help.