A PnL calendar is a month grid where each trading day shows the net profit or loss you made that day, green for a profit and red for a loss. Most also show how many trades you took, a total for each week and a summary for the month. Reading one well means looking past the month total to how it was made: how many days carried the month, how big the worst day was, and which weeks gave back what the good days made.
What a PnL calendar shows
- Day cells. Net PnL for each trading day, after commissions and fees. The stronger the colour, the bigger the day compared with the rest of the month.
- Trades per day. A small count in the corner of each day.
- Week column. The week's net PnL and its percentage return, so you can compare weeks without adding up cells.
- Monthly summary. The month's net PnL and return, total trades, win rate, and how many days were green and how many red.
- Blank days. Weekends, holidays and days you didn't trade. A blank day counts as neither a win nor a loss.
How to read a PnL calendar: one month, worked through
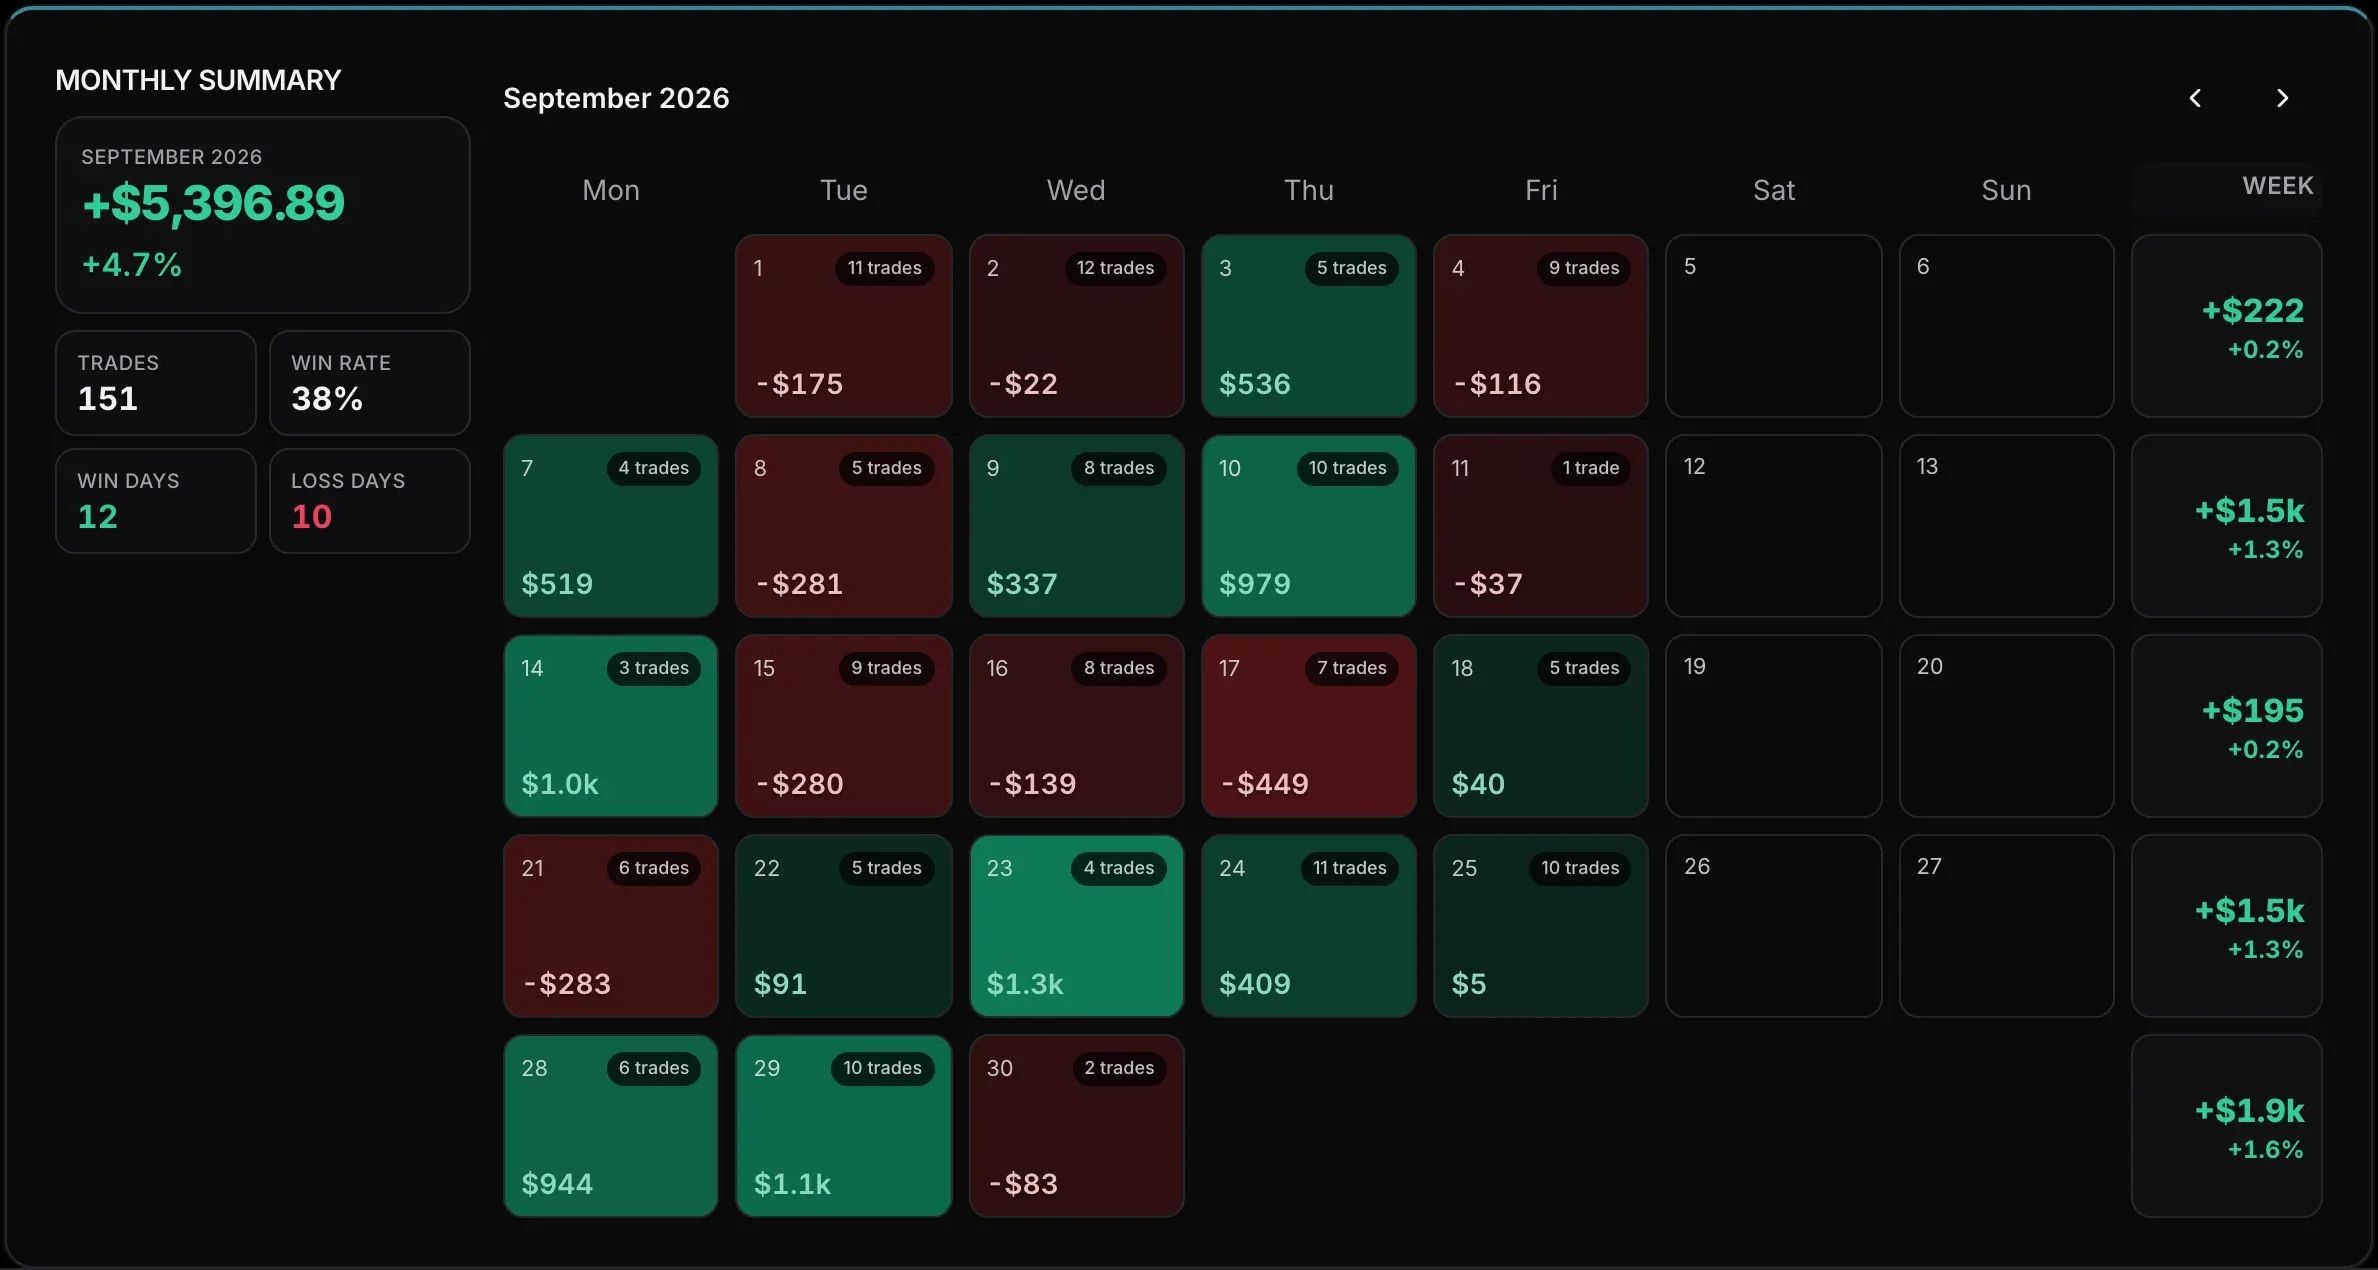
The month made +$5,396.89, a 4.7% return, from 151 trades at a 38% win rate. The cells show how it was made.
1. Count the days that made the month
Rank the green days. On this calendar the five best days made about $5,320, close to the whole month. The other 17 trading days, wins and losses together, came to about +$70.
| Day | Trades | Net PnL |
|---|---|---|
| Sep 23 | 4 | about +$1,300 |
| Sep 29 | 10 | about +$1,100 |
| Sep 14 | 3 | about +$1,000 |
| Sep 10 | 10 | +$979 |
| Sep 28 | 6 | +$944 |
| Other 17 days | 118 | about +$70 |
That's still a good month, but it rested on five days. Each of them is worth about 20% of the month on average, and the remaining days only broke even. If your calendar looks like this, the work is in the ordinary days.
2. Compare the worst day with the best day
The worst day, the 17th, lost $449. The best made about $1,300. No red day came close to wiping out a big green day, which is what a stop-loss plan is meant to produce. If one red cell is bigger than your best green one, review that day first.
3. Read each week row from left to right
The third week opened with about +$1,000 on Monday. The next three days lost $280, $139 and $449, Friday added $40, and the week finished at +$195. The week total hides a strong Monday followed by three losing days in a row. Open the trades on those three days to see whether the market changed or your size grew after a good Monday.
4. Don't confuse green days with winning trades
This month had 12 green days and 10 red ones, so 55% of trading days made money. The trade win rate was 38%. Both numbers are correct. A day can be green with more losing trades than winning ones, as long as the winners are bigger. Use the trade win rate to judge your edge, and green days for how the month felt to trade.
5. Look at trades per day
The busiest day, the 2nd with 12 trades, lost money, and so did the 1st with 11. Two of the three best days, the 23rd and the 14th, had only 4 and 3 trades. One month doesn't prove overtrading: the 29th made about $1,100 on 10 trades. Still, if your red days are also your busiest, filter the calendar by setup or time of day before the next session.
What a PnL calendar can't tell you
A calendar shows when you made or lost money. The reason is in the trades: a bad setup, a news spike and a broken rule all turn the same cell red. One month is also a small sample, and twenty-odd days can't tell you whether a pattern is real. Before acting on one, read how many trades you need before you trust your win rate.
Get the days right before you read them
Three things decide which day a trade lands on and what it counts as.
- Futures days start at 5pm Central. CME futures trade from Sunday evening, so a trade at 6pm Central on Sunday belongs to Monday's trading day. A calendar that groups by midnight puts it on the wrong day.
- Net, not gross. Commissions and fees can turn a small green day red. The difference is explained in what PnL means in trading.
- Deposits are not profit. A deposit or withdrawal changes the balance, not PnL, so it should be marked on the day rather than added to it.
A PnL calendar in a spreadsheet vs a trading journal
You can build a PnL calendar in Excel or Google Sheets with a SUMIFS per day and conditional formatting. It works until you need weekly percentages that ignore deposits, a futures day that starts at 5pm, or a calendar for one setup only. The free trading journal template has the daily formulas built.
The ExpectancyIQ trading journal builds the calendar from your broker's CSV import, on the free plan. Each day is net of costs and grouped by the futures session, the Week column shows dollars and percentage, and clicking a day opens its trades. It sits next to the trading dashboard, which shows today, this week, this month and this quarter. How each number is calculated is on the methodology page. This article is educational, not financial advice.